

Question: Question 1 Test score 780 Linear regression 760 Linear-log regression 740 720 Cubic regression 700 680 660 640 620 0 10 20 30 40 50
Question 1
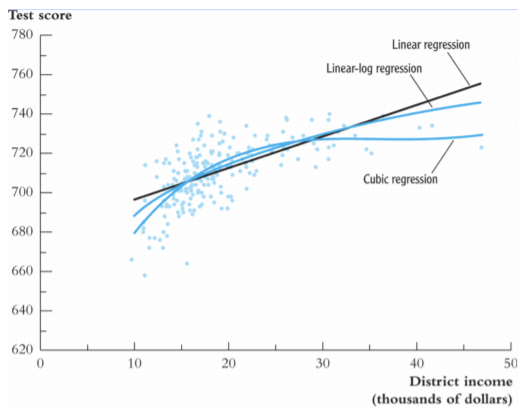
Test score 780 Linear regression 760 Linear-log regression 740 720 Cubic regression 700 680 660 640 620 0 10 20 30 40 50 District income (thousands of dollars)QUESTION 1 Choose the wrong statement regarding Figure 9.1 of Stock and Watson (the left graph on page 19 of Lecture Slides 7). a. The graph shows 220 data points (please do not count on the graph!). P. The scatter diagram shows some nonlinearity in the relationship between TestScore and District Income. O C. The following R-code estimates the linear regression: > Im_robust(score4 ~ income, se_type = "HC1") O d. The following R-code estimates the cubic regression: > Im_robust(score4 ~ income + income*2 + income^3, se_type = "HC1") O e. The following R-code estimates the linear-log regression: > Im_robust(score4 - log(income), se_type = "HC1")
Step by Step Solution
There are 3 Steps involved in it

Get step-by-step solutions from verified subject matter experts