

Question: Question 4 Test score 780 Linear regression 760 Linear-log regression 740 720 Cubic regression 700 680 660 640 620 0 10 20 30 40 50
Question 4
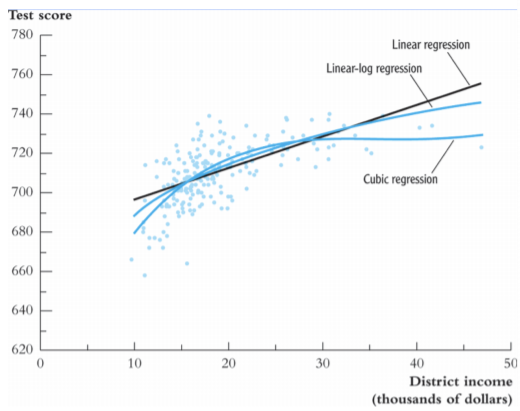
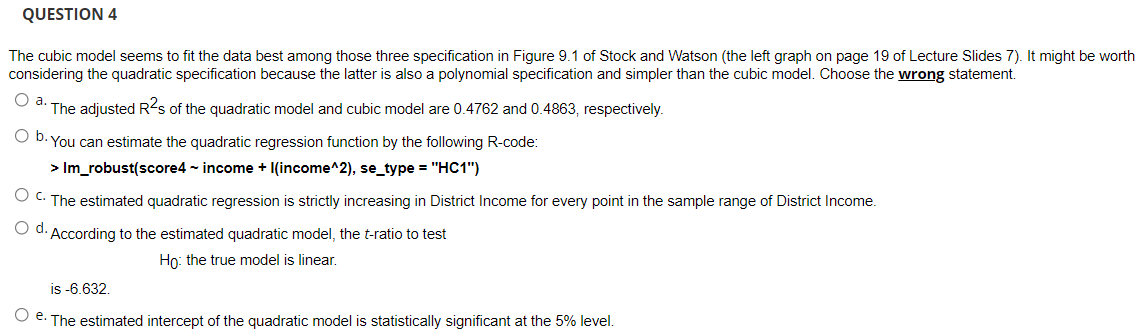
Test score 780 Linear regression 760 Linear-log regression 740 720 Cubic regression 700 680 660 640 620 0 10 20 30 40 50 District income (thousands of dollars)QUESTION 4 The cubic model seems to t the data best among those three specication in Figure 9.1 of Stock and Watson (the left graph on page 19 of Lecture Slides i"). It might be worth considering the quadratic specication because the latter is also a polynomial specication and simpler than the cubic model. Choose the wrong statement. 0 a. The adjusted R25 of the quadratic model and cubic model are 0.4?62 and 0.4863. respectively. 0 b' You can estimate the quadratic regression function by the followmg Rcode: > |m_robust{scored ~ income + l(income'2}, se_type = "HC1"] O c. The estimated quadratic regression is strictly increasing in District Income for every point in the sample range of District Income. 0 d'ACCOlenQ to the estimated quadratic model, the tratio to test H0: the true model is linear. is 46.632. O '3' The estimated intercept of the quadratic model is statistically signicant at the 5% level
Step by Step Solution
There are 3 Steps involved in it

Get step-by-step solutions from verified subject matter experts