

Question: Question 1. The data on a table are as follows: he data on a table. X represents your TV ads. T represents your Sales. Plot

Question 1.
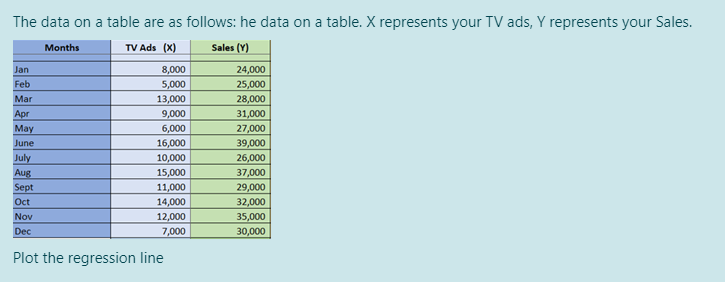
The data on a table are as follows: he data on a table. X represents your TV ads. T represents your Sales. Plot the regression line
Step by Step Solution
There are 3 Steps involved in it
1 Expert Approved Answer
Step: 1 Unlock

Question Has Been Solved by an Expert!
Get step-by-step solutions from verified subject matter experts
Step: 2 Unlock
Step: 3 Unlock