

Question: Question 1 The graph of a function fis given. Use the graph to estimate the following. X (a) All the local maximum and minimum values
Question 1
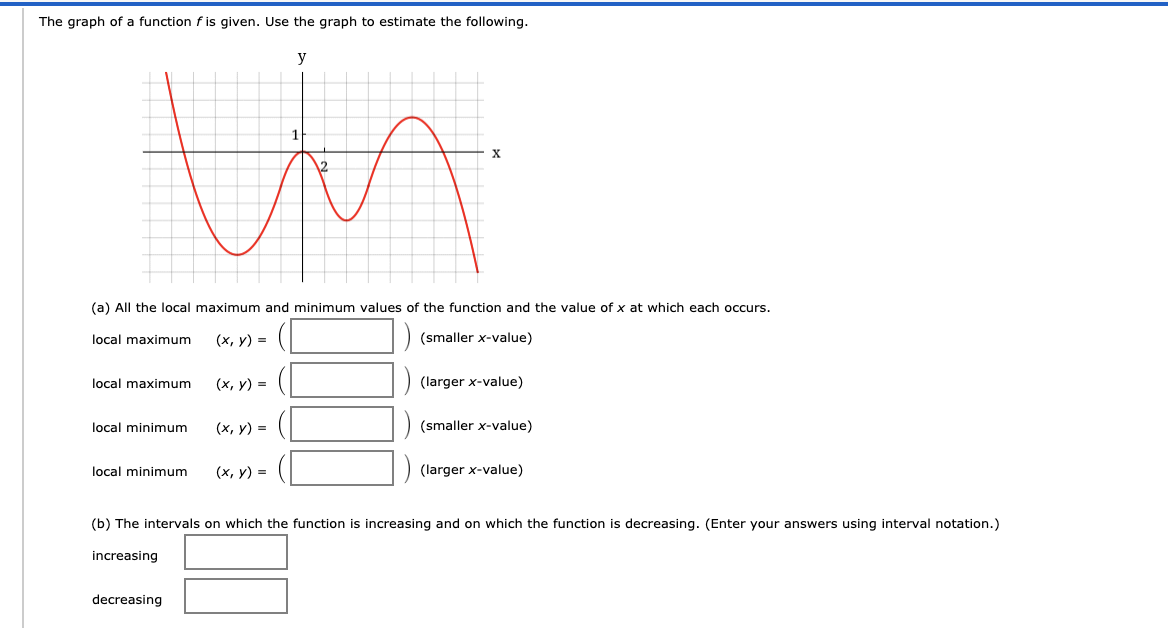
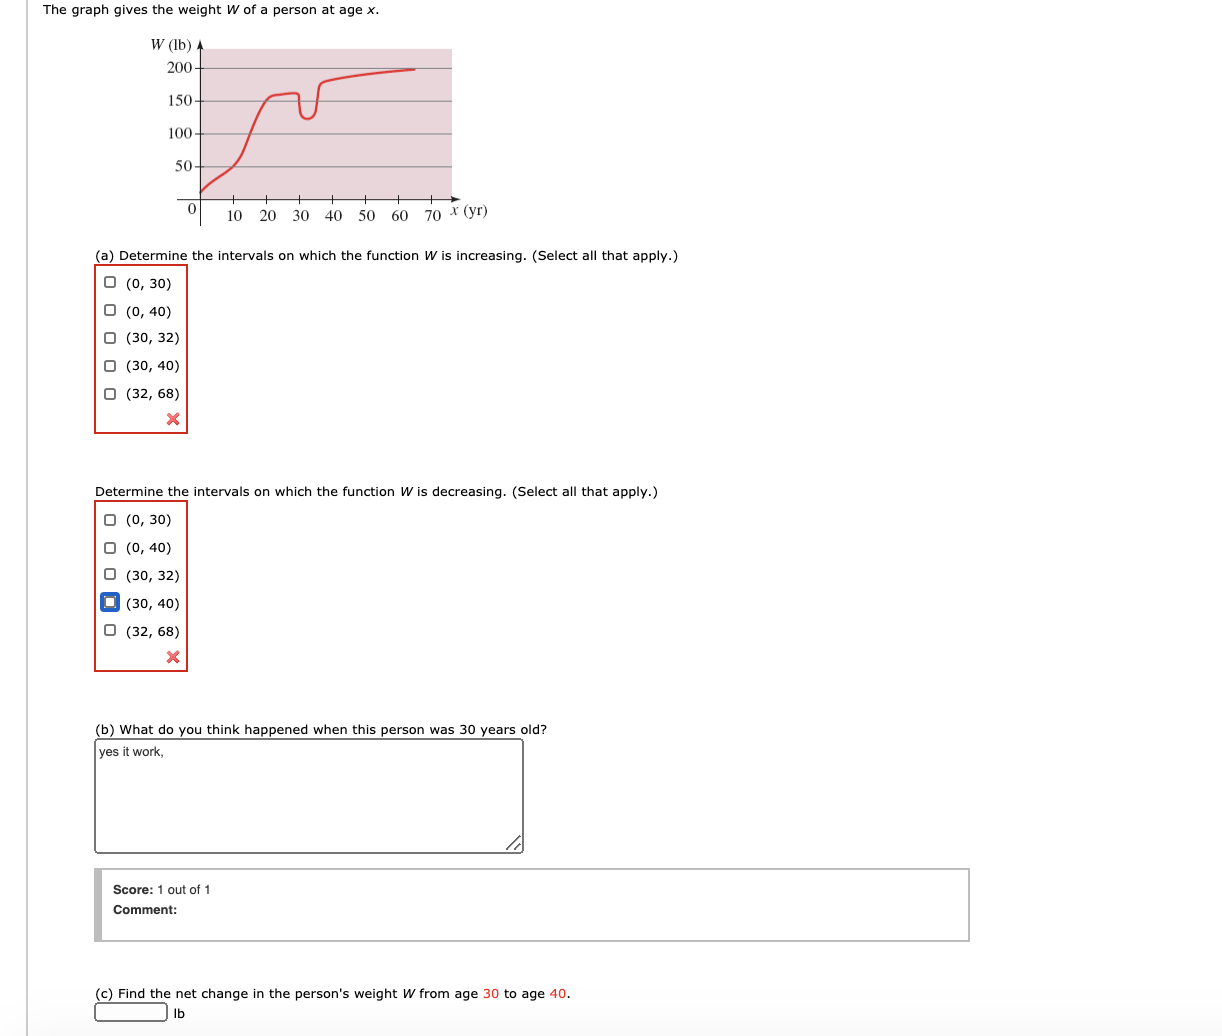
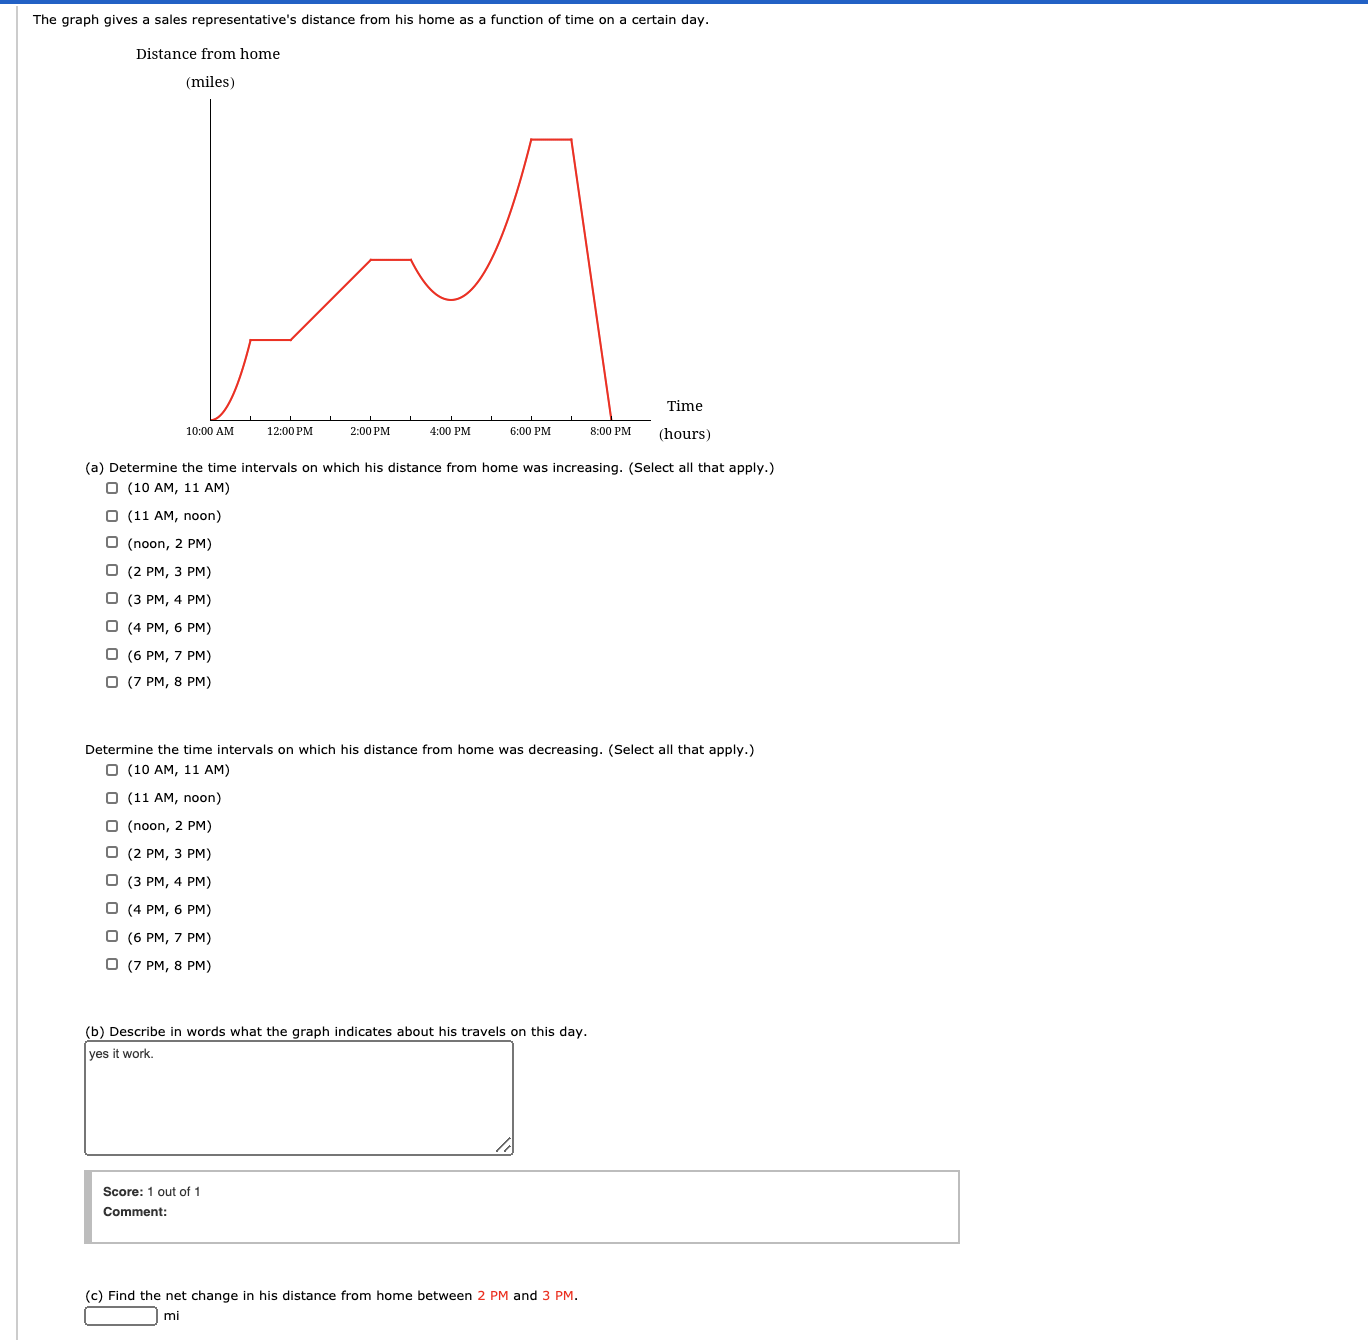
The graph of a function fis given. Use the graph to estimate the following. X (a) All the local maximum and minimum values of the function and the value of x at which each occurs. local maximum (x, y) = (smaller x-value) local maximum ( x, y ) = (larger x-value) local minimum ( x, y ) = (smaller x-value) local minimum ( x, y ) = (larger x-value) (b) The intervals on which the function is increasing and on which the function is decreasing. (Enter your answers using interval notation.) increasing decreasingThe graph gives the weight W of a person at age x. W (1b) 4 200- 150- 100- 50 10 20 30 40 50 60 70 * (yr) (a) Determine the intervals on which the function W is increasing. (Select all that apply.) O (0, 30) O (0, 40) O (30, 32) O (30, 40) O (32, 68) X Determine the intervals on which the function W is decreasing. (Select all that apply.) O (0, 30) O (0, 40) O (30, 32) (30, 40) O (32, 68) X (b) What do you think happened when this person was 30 years old? yes it work, Score: 1 out of 1 Comment: (c) Find the net change in the person's weight W from age 30 to age 40. IbThe graph gives a sales representative's distance from his home as a function of time on a certain day. Distance from home (miles) Time 10:00 AM 12:00 PM 2:00 PM 4:00 PM 6:00 PM 8:00 PM (hours) (a) Determine the time intervals on which his distance from home was increasing. (Select all that apply.) O (10 AM, 11 AM) O (11 AM, noon) O (noon, 2 PM) O (2 PM, 3 PM) O (3 PM, 4 PM) O (4 PM, 6 PM) O (6 PM, 7 PM) O (7 PM, 8 PM) Determine the time intervals on which his distance from home was decreasing. (Select all that apply. ) O (10 AM, 11 AM) O (11 AM, noon) O (noon, 2 PM) O (2 PM, 3 PM) O (3 PM, 4 PM) O (4 PM, 6 PM) O (6 PM, 7 PM) D (7 PM, 8 PM) (b) Describe in words what the graph indicates about his travels on this day. yes it work. Score: 1 out of 1 Comment: c) Find the net change in his distance from home between 2 PM and 3 PM. mi
Step by Step Solution
There are 3 Steps involved in it

Get step-by-step solutions from verified subject matter experts