

Question: Question 1 The table below shows the lifetime (in hours) of eighty randomly selected orchid blooms. Class(hours) Frequency 51 -60 6 61 - 70 12
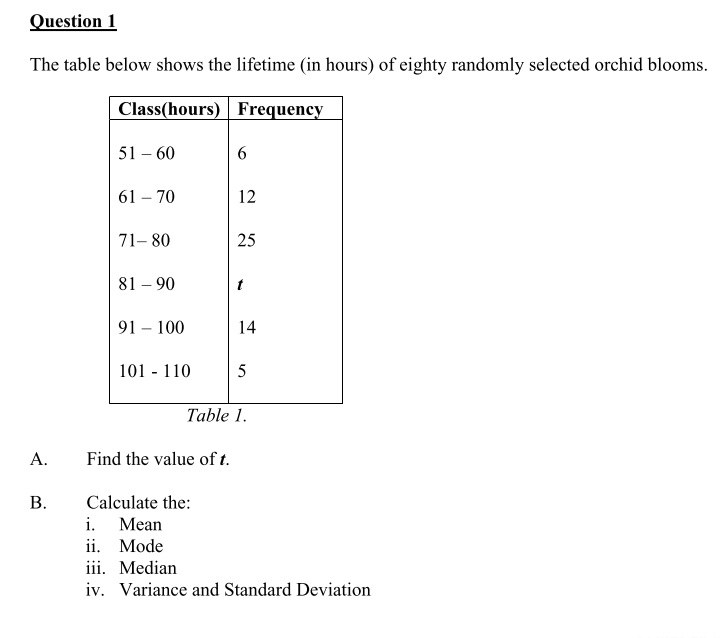

Question 1 The table below shows the lifetime (in hours) of eighty randomly selected orchid blooms. Class(hours) Frequency 51 -60 6 61 - 70 12 71-80 25 81 -90 91 - 100 14 101 - 110 5 Table 1. A. Find the value of t. B. Calculate the: 1 . Mean ii. Mode iii. Median iv. Variance and Standard Deviation
Step by Step Solution
There are 3 Steps involved in it
1 Expert Approved Answer
Step: 1 Unlock

Question Has Been Solved by an Expert!
Get step-by-step solutions from verified subject matter experts
Step: 2 Unlock
Step: 3 Unlock