

Question: Question 1: There are two Figures given below. Figure 1 shows five US yield curves at different points in time. Figure 2 displays real US
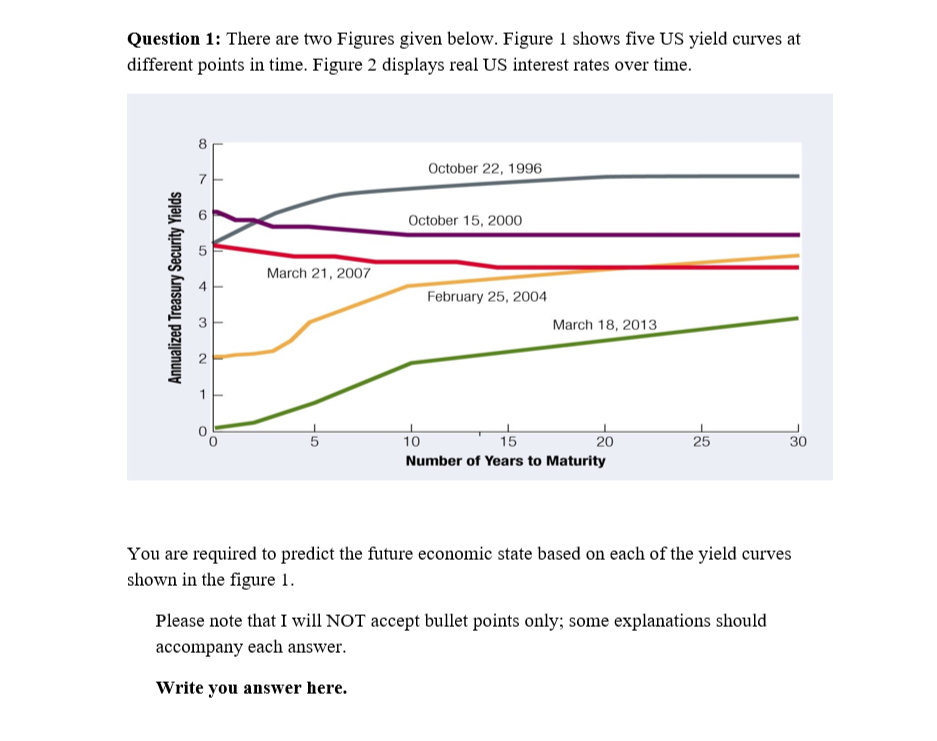
Question 1: There are two Figures given below. Figure 1 shows five US yield curves at different points in time. Figure 2 displays real US interest rates over time. October 22, 1996 October 15, 2000 March 21, 2007 Annualized Treasury Security Yields February 25, 2004 March 18, 2013 - 5 10 15 20 25 30 Number of years to Maturity You are required to predict the future economic state based on each of the yield curves shown in the figure 1. Please note that I will NOT accept bullet points only; some explanations should accompany each answer. Write you answer here
Step by Step Solution
There are 3 Steps involved in it
1 Expert Approved Answer
Step: 1 Unlock

Question Has Been Solved by an Expert!
Get step-by-step solutions from verified subject matter experts
Step: 2 Unlock
Step: 3 Unlock