

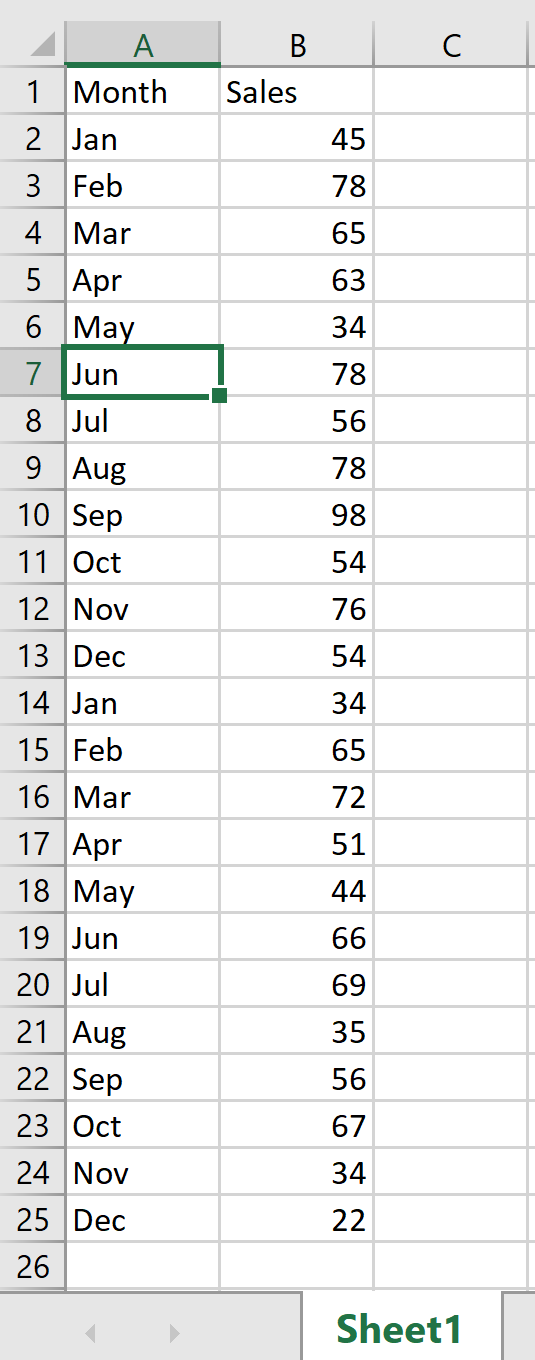
Question: Question # 1 Use the attached sales data to do a 4 month and 6 month moving average using Excel. Present your data in both
Question #
Use the attached sales data to do a month and month moving average using Excel. Present your data in both table form and using a graph.
a What differences do you see in the two curves?
b Calculate the expected error MAD in the curves. What is the difference and how would affect your decisions on the two forecasting models?
Question #
Use the same data to perform an exponential smoothing, using an alpha of and Present both tables and graphs of your data.
a How does your answer change with the differing alphas Which model would you choose and why?
b What is the difference in using either model for your forecasting?
Step by Step Solution
There are 3 Steps involved in it
1 Expert Approved Answer
Step: 1 Unlock

Question Has Been Solved by an Expert!
Get step-by-step solutions from verified subject matter experts
Step: 2 Unlock
Step: 3 Unlock