

Question: subject: supply chain managemnt Forecast ing (chapter 4) Using the demand data from the table below, Develop 3 different forecast models for the month of
subject: supply chain managemnt
Forecasting (chapter 4)
Using the demand data from the table below, Develop 3 differentforecast models for the month of April to September (Periods 4 through 9)
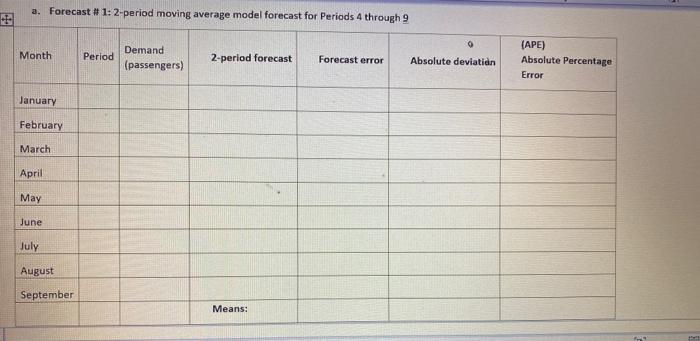
a. Forecast # 1: Use 2 period moving average model forecast
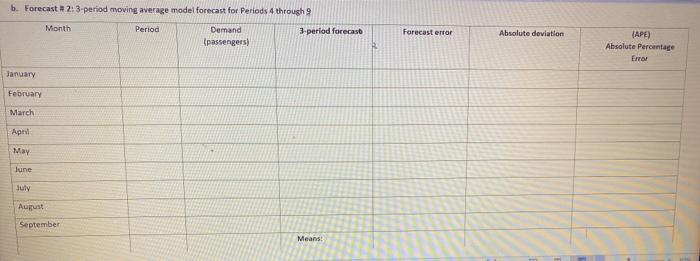
b. Forecast # 2: Use 3 period moving average model forecast
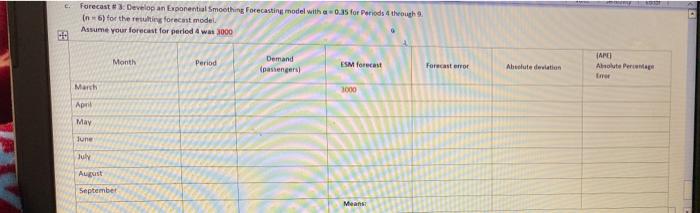
c. Forecast # 3: Use Exponential Smoothing Forecasting model
Calculate the MFE & MAD and APE for Periods 4 through (n = 6) for all 3 Forecasts.
NOTE: Show all your manual calculations and formulas on the last page. (no Manual calculations and formulas = no grades for the forecasts)
this is the part of this question.
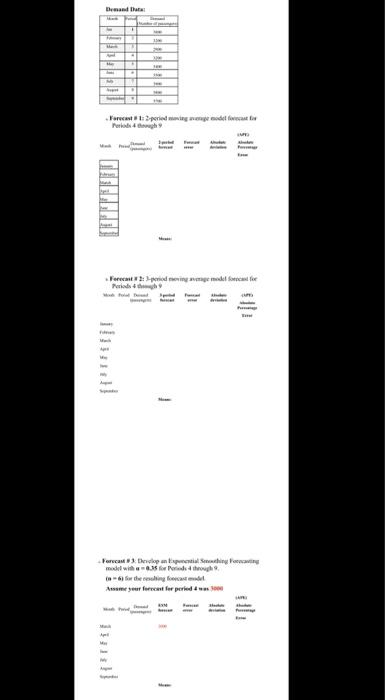
Demand Data:
Month | Period | Demand (Number of passengers) |
Jan | 1 | 3800 |
February | 2 | 3200 |
March | 3 | 2900 |
April | 4 | 3200 |
May | 5 | 3400 |
June | 6 | 3500 |
July | 7 | 3900 |
August | 8 | 5800 |
September | 9 | 5700 |
Step by Step Solution
There are 3 Steps involved in it
1 Expert Approved Answer
Step: 1 Unlock

Question Has Been Solved by an Expert!
Get step-by-step solutions from verified subject matter experts
Step: 2 Unlock
Step: 3 Unlock