

Question: Question 1 Use the data in the following table, which lists drive-thru order accuracy at popular fast food chains. Assume that orders are randomly selected
Question 1
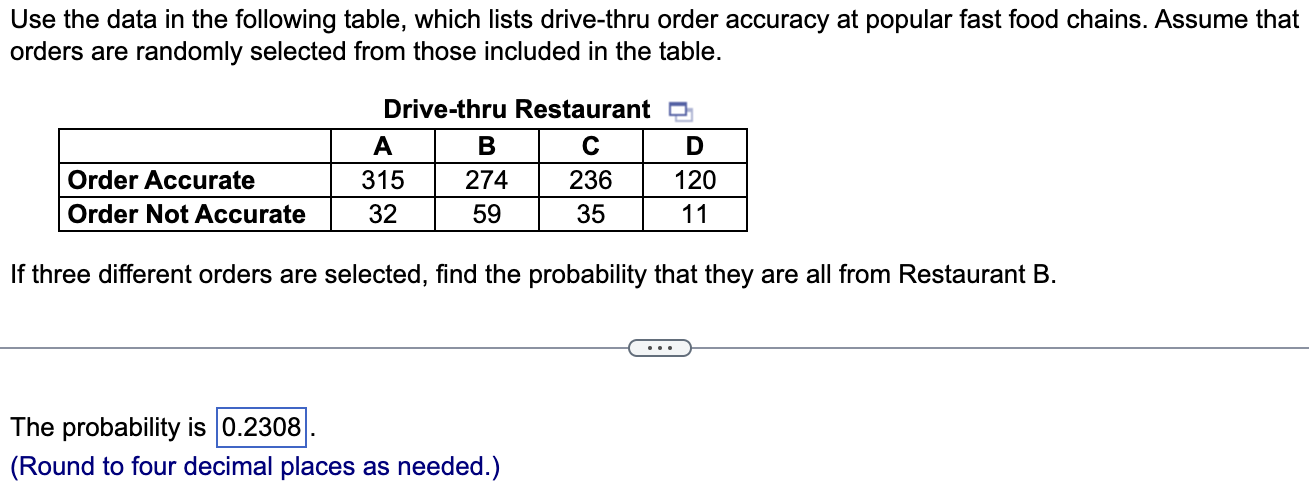
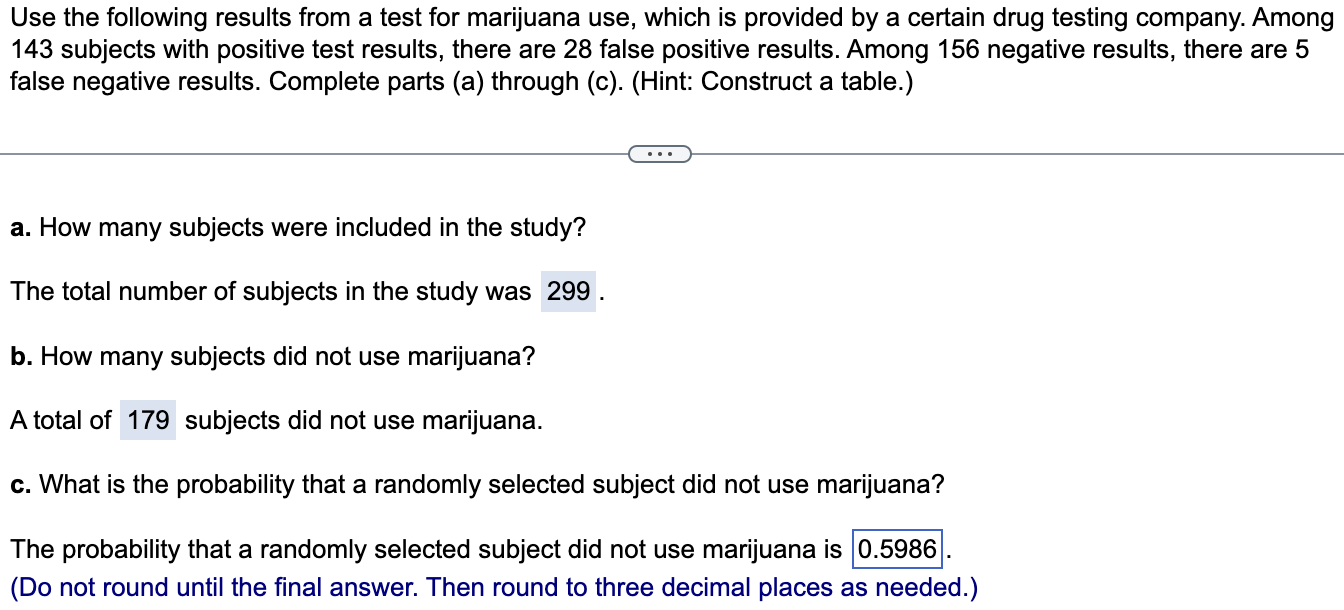
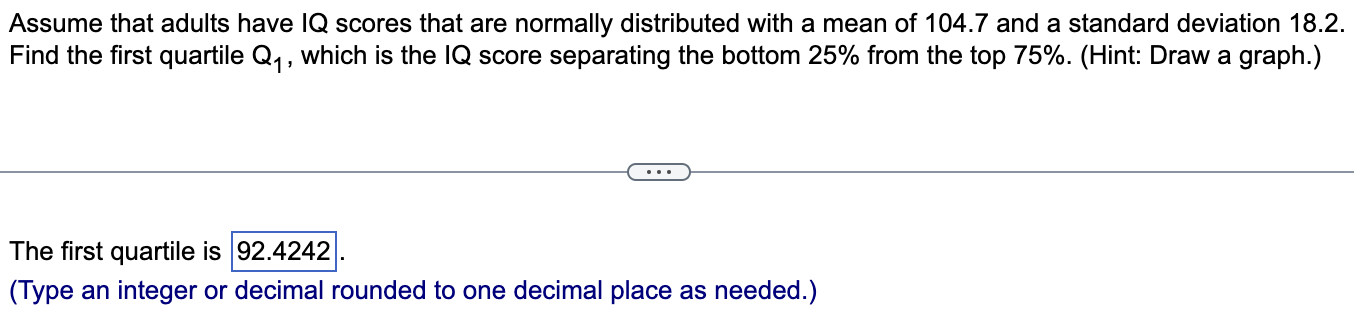
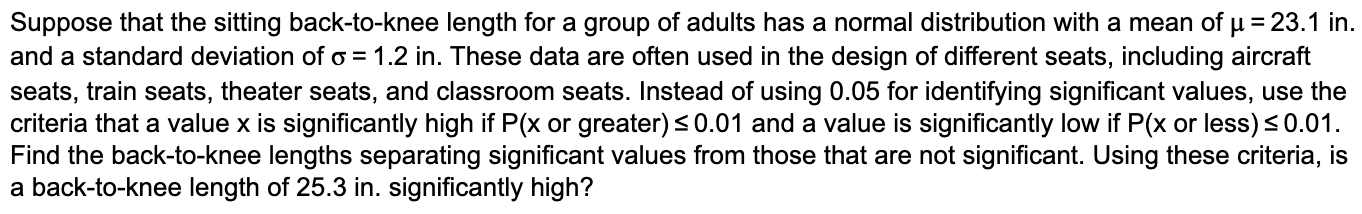

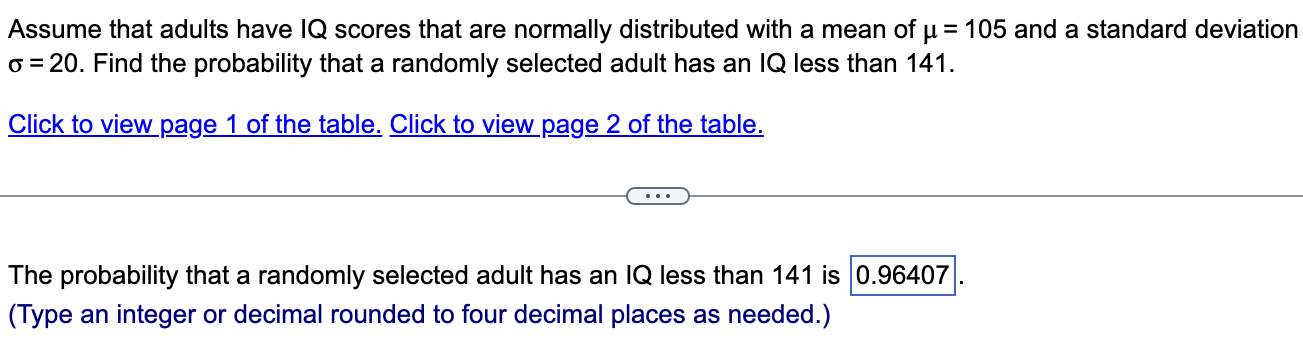
Use the data in the following table, which lists drive-thru order accuracy at popular fast food chains. Assume that orders are randomly selected from those included in the table. Drive-thru Restaurant A B C D Order Accurate 315 274 236 120 Order Not Accurate 32 59 35 11 If three different orders are selected, find the probability that they are all from Restaurant B. . . . The probability is 0.2308 (Round to four decimal places as needed.)Use the following results from a test for marijuana use, which is provided by a certain drug testing company. Among 143 subjects with positive test results, there are 28 false positive results. Among 156 negative results, there are 5 false negative results. Complete parts (a) through (c). (Hint: Construct a table.) (3 a. How many subjects were included in the study? The total number of subjects in the study was 299 . b. How many subjects did not use marijuana? A total of 179 subjects did not use marijuana. c. What is the probability that a randomly selected subject did not use marijuana? The probability that a randomly selected subject did not use marijuana is 0.5986 . {Do not round until the nal answer. Then round to three decimal places as needed.) Assume that adults have IQ scores that are normally distributed with a mean of 104.7 and a standard deviation 18.2. Find the rst quartile Q1 , which is the IQ score separating the bottom 25% from the top 75%. (Hint: Draw a graph.) The first quartile is 92.4242 . (Type an integer or decimal rounded to one decimal place as needed.) Suppose that the sitting back-to-knee length for a group of adults has a normal distribution with a mean of u = 23.1 in. and a standard deviation of o = 1.2 in. These data are often used in the design of different seats, including aircraft seats, train seats, theater seats, and classroom seats. Instead of using 0.05 for identifying significant values, use the criteria that a value x is significantly high if P(x or greater) pz H13P1=92 Ho5p15p2 H03P1=P2 H03p1=92 H15p192 \"1:917592 H15p1
Step by Step Solution
There are 3 Steps involved in it

Get step-by-step solutions from verified subject matter experts