

Question: Question 1: What can be concluded from the dashboard? A. Companies that have higher current ratios have higher current cash debt coverage. B. Companies that
Question 1:
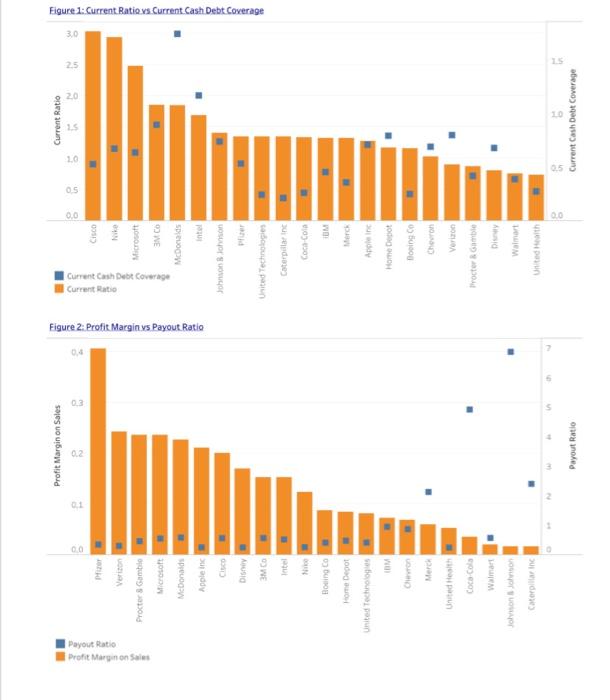
What can be concluded from the dashboard?
A. Companies that have higher current ratios have higher current cash debt coverage.
B.Companies that have higher profit margin on sales have lower payout ratios.
C. IT companies have higher profit margin on sales compared to other industries.
D. IT companies tend to have higher payout ratios.
Question 2:
Which of the following statements are true?
A. Companies of similar industries have similar profit margin ratios.
B. Companies of similar industries have similar payout ratios.
C.Most companies shown on the dashboard will have trouble using cash to pay immediate debts.
D. The dashboard shows a correlation between current ratio and current cash debt coverage.
Profit Margin on Sales Current Ratio 04 0.0 OS 08 1 Cisco Profit Marino Sales Payout Ratio Nike Verizon Figure 2: Profit Marginys Payout Ratio Current Ratio Current Cash Debt Coverage Procter & Gamble Microsoft Microsoft Figure 1: Current Ratio vs Current Cash Debt Coverage McDonalds McDonalds Appleine Intel CISCO Johnson Blohon AUSIO Per 3MCO Intel United Technologies Caterpillar Inc Coca-Cola Ne Boeing Co WO Home Depot United Technologies Anne IM Home Depot CO Boeing Merch Chevron United Health Verizon Coca Cola Procter Robe Walmart Joliton John Caterpillar Inc Walmart United Health 5 Current Cash Debt Coverage Payout Ratio
Step by Step Solution
There are 3 Steps involved in it

Get step-by-step solutions from verified subject matter experts