

Question: Question 1 What is the mean wingspan in this sample of birds? (Round to the nearest 10th) 170m, 150m, 180m, 220m, 14cm, 17cm, 19cm Question
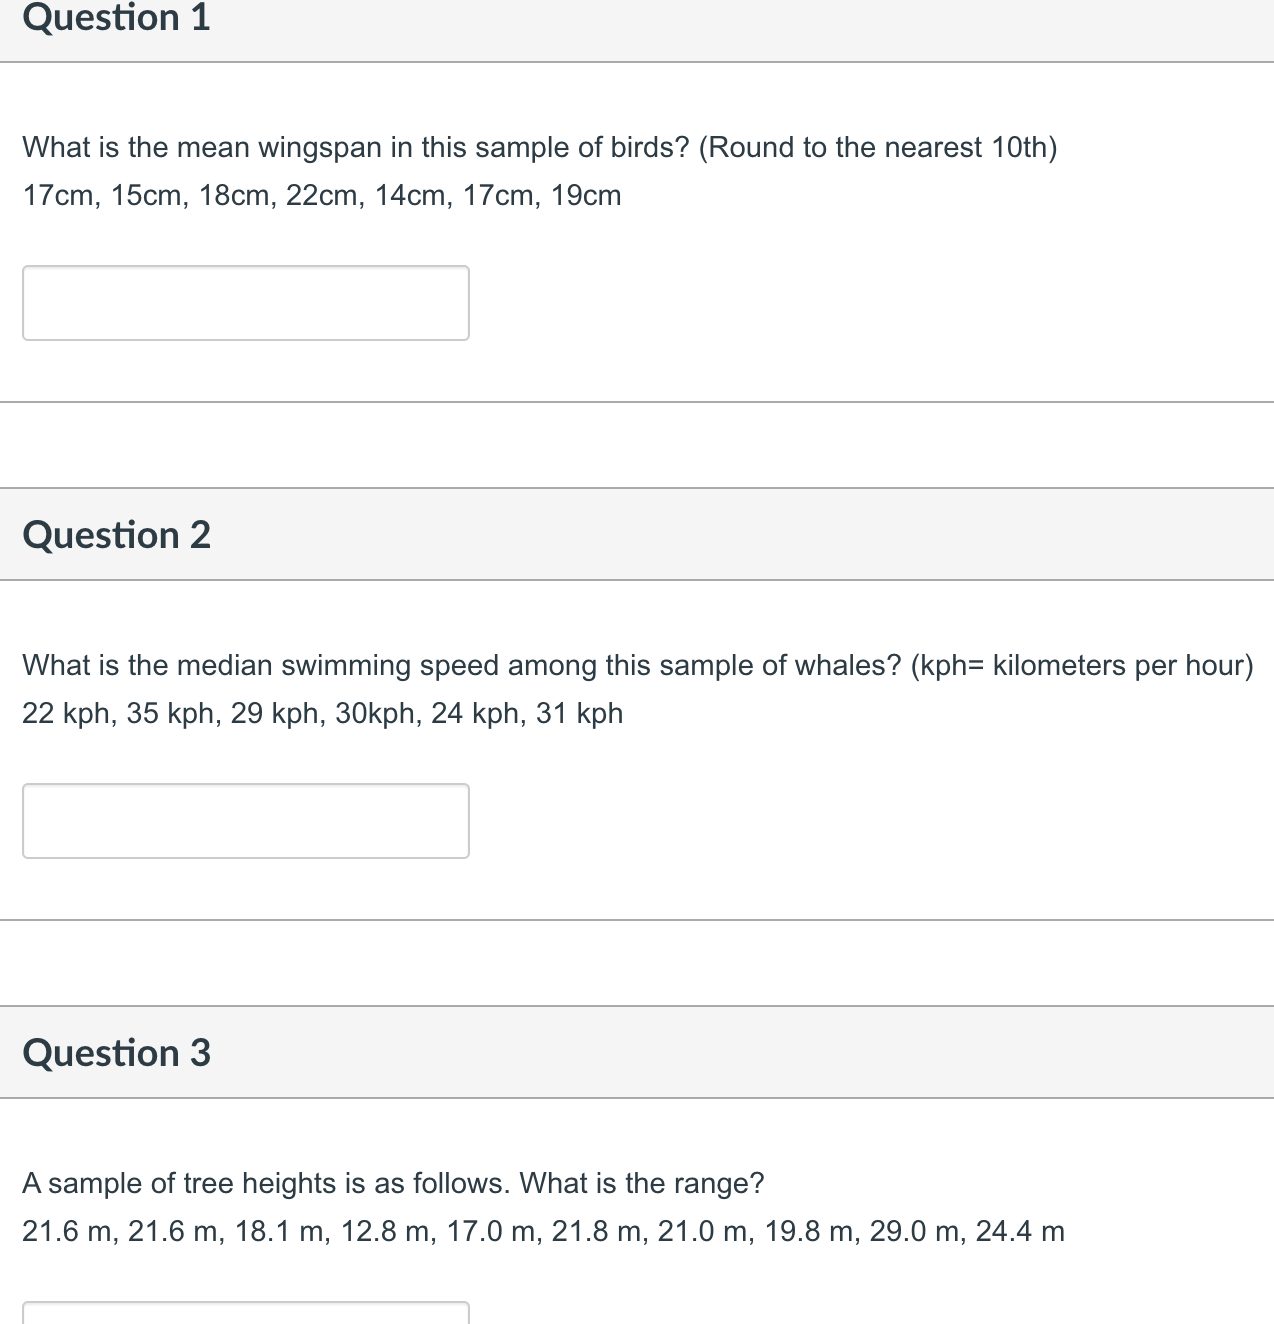


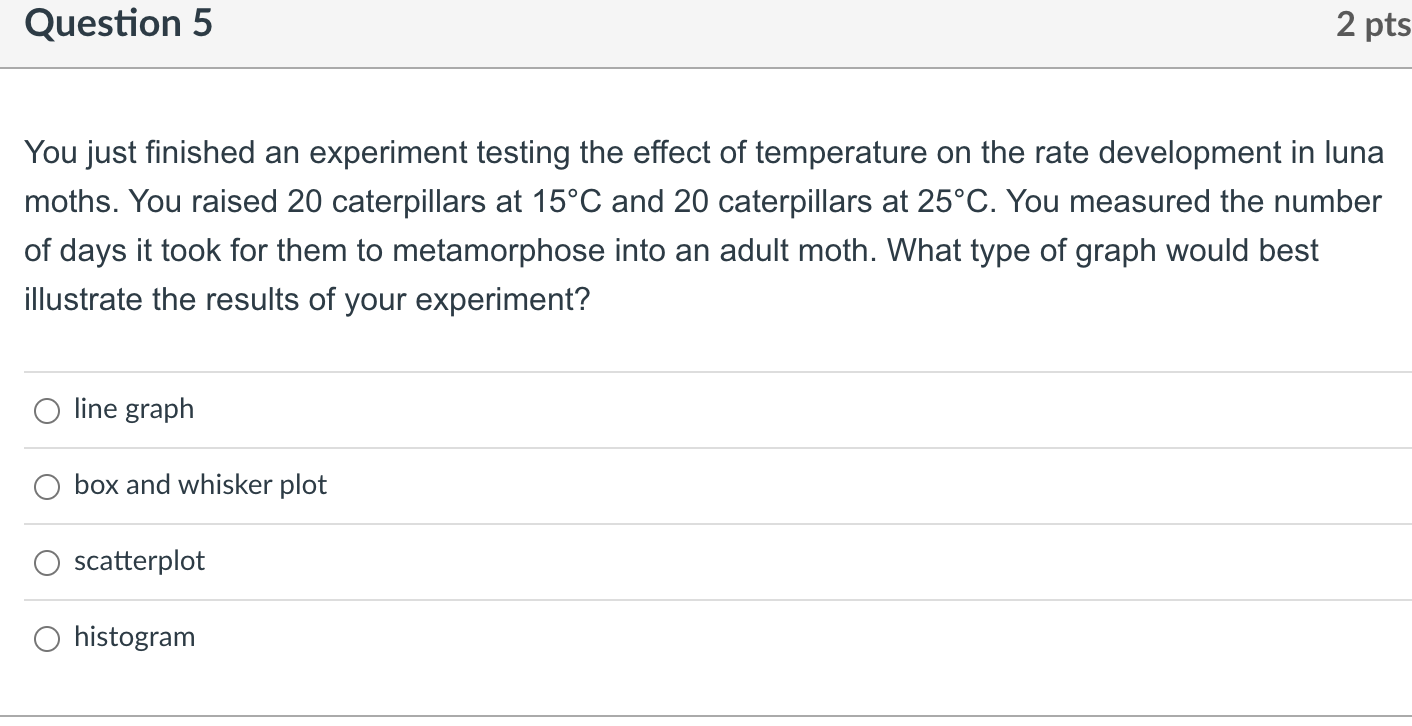
Question 1 What is the mean wingspan in this sample of birds? (Round to the nearest 10th) 170m, 150m, 180m, 220m, 14cm, 17cm, 19cm Question 2 What is the median swimming speed among this sample of whales? (kph= kilometers per hour) 22 kph, 35 kph, 29 kph, 30kph, 24 kph, 31 kph Question 3 A sample of tree heights is as follows. What is the range? 21.6 m, 21.6 m, 18.1 m, 12.8 m, 17.0 m, 21.8 m, 21.0 m, 19.8 m, 29.0 m, 24.4 m Question 5 2 pts You just finished an experiment testing the effect of temperature on the rate development in luna moths. You raised 20 caterpillars at 15C and 20 caterpillars at 25C. You measured the number of days it took for them to metamorphose into an adult moth. What type of graph would best illustrate the results of your experiment? O line graph O box and whisker plot O scatterplot O histogram
Step by Step Solution
There are 3 Steps involved in it

Get step-by-step solutions from verified subject matter experts