

Question: Question: 1. With the spend Analysis ABC Data ( By dollar Amount)below, what can you say as a buyer of the company? 2. With the
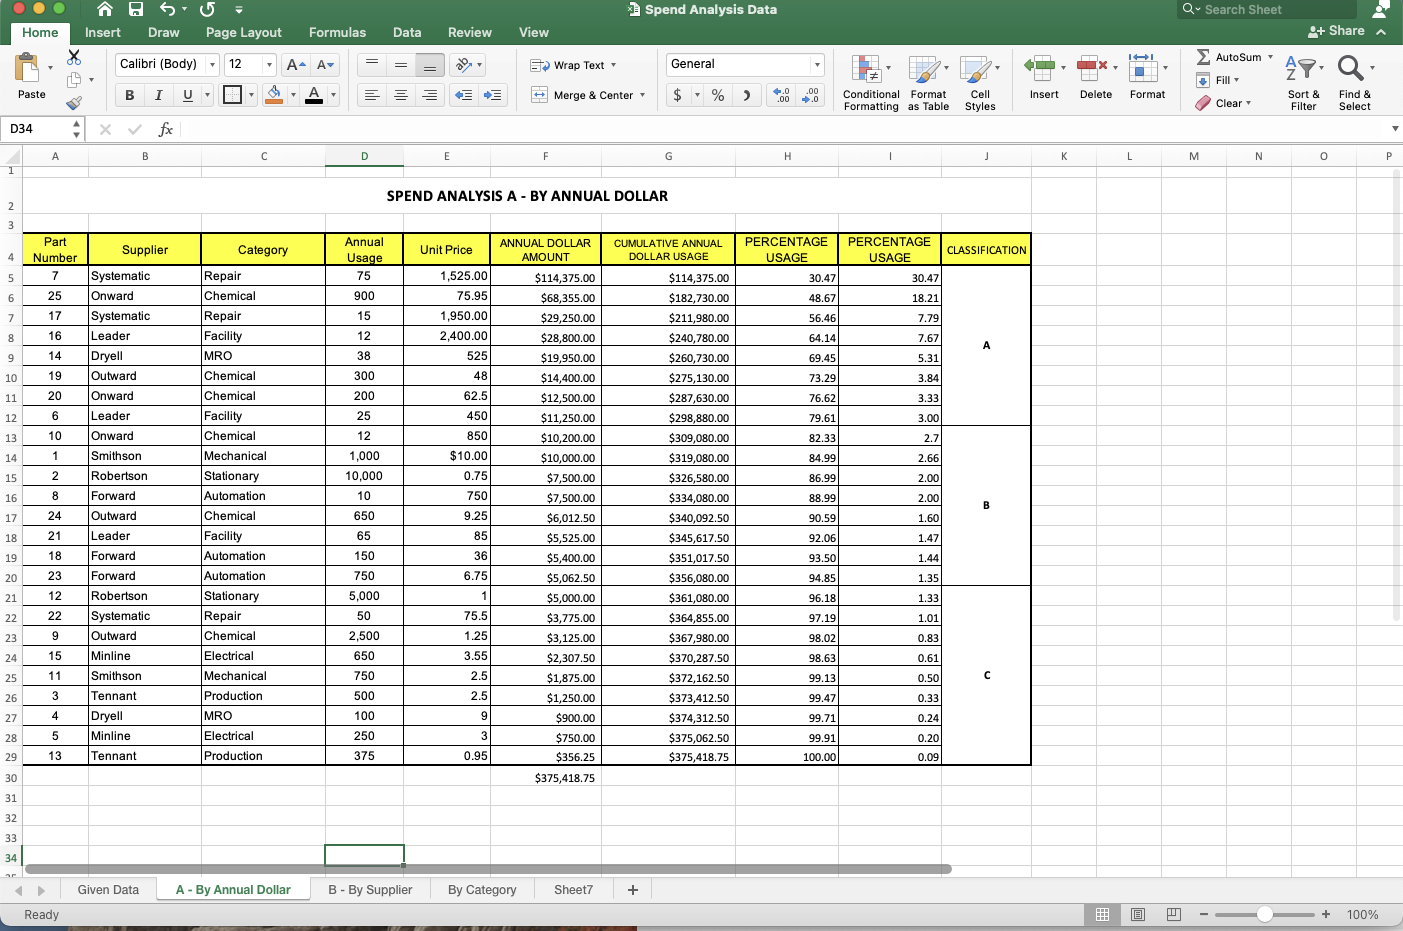
Question: 1. With the spend Analysis ABC Data ( By dollar Amount)below, what can you say as a buyer of the company?
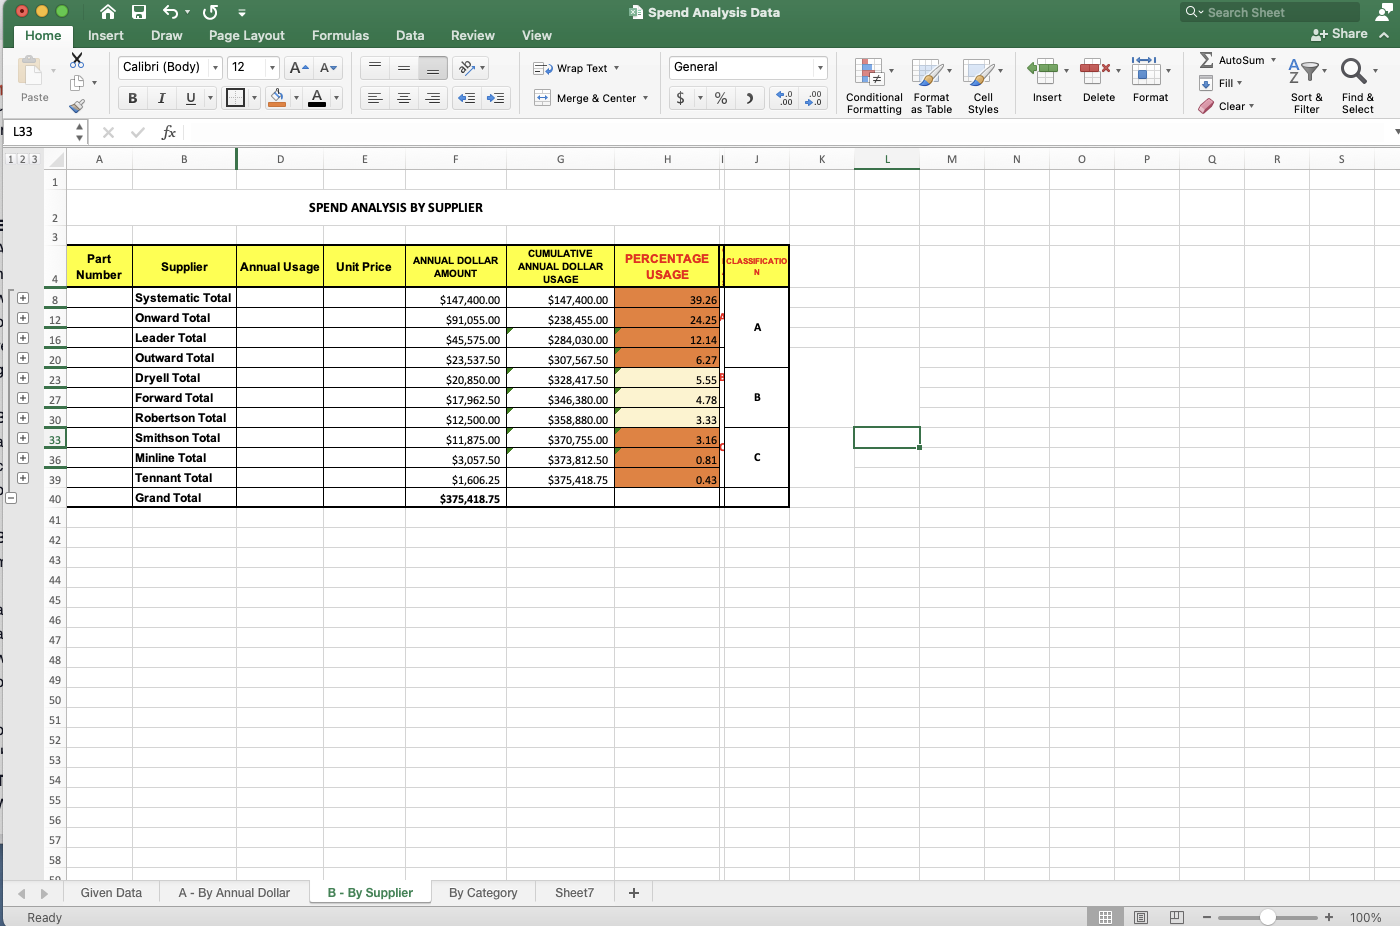
 2. With the spend Analysis - ABC Data ( By Supplier) below, what can you say as a buyer of the company?
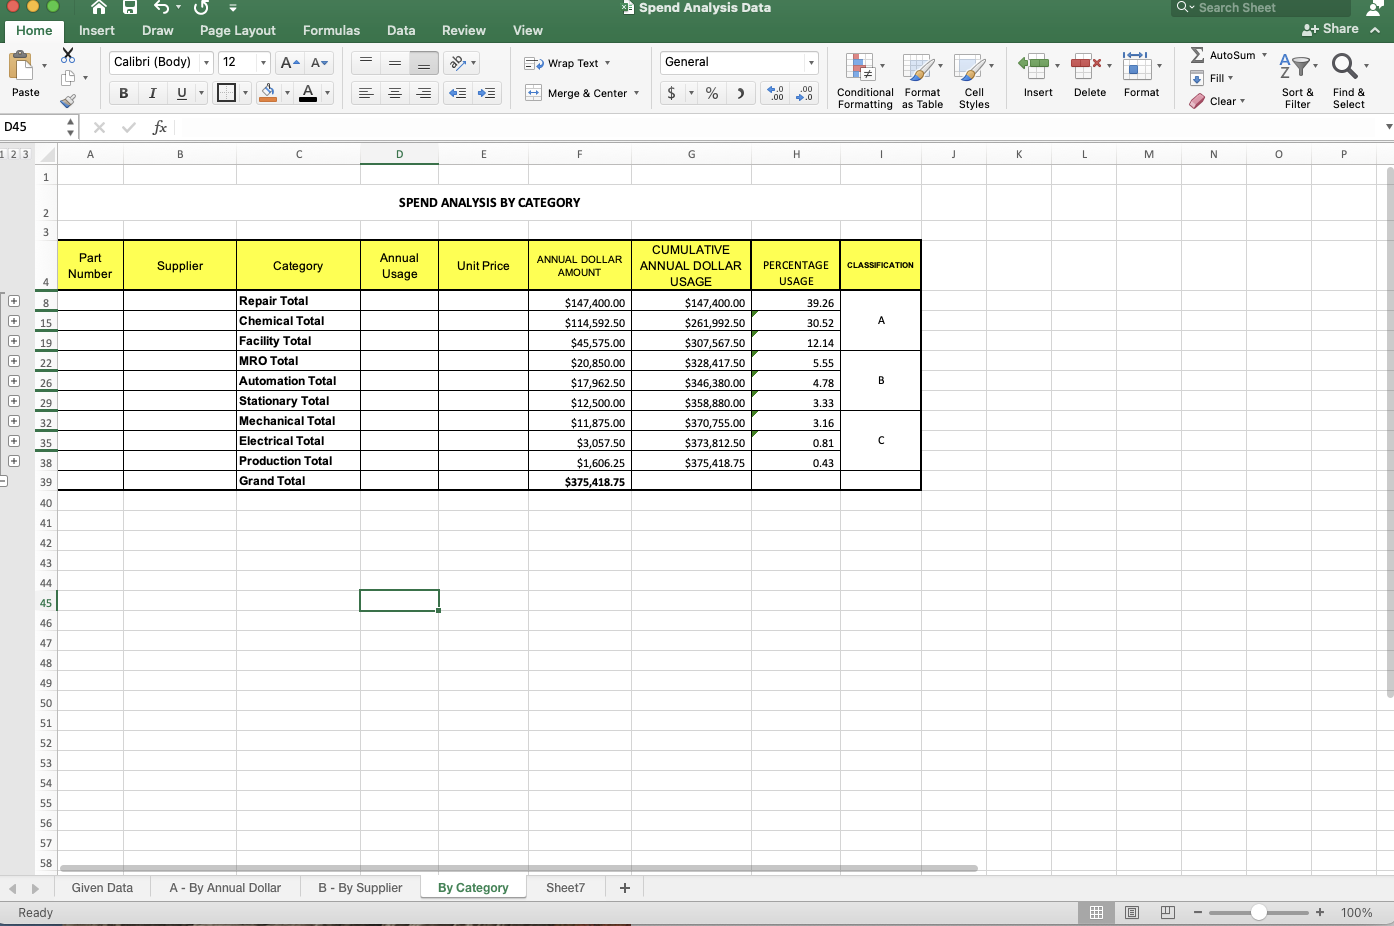
 3. With the spend Analysis - ABC Data ( By Category) below, what can you say as a buyer of the company?
4. What can be done with this ABC Analysis information to improve your purchase process in the future?
Spend Analysis Data Q- Search Sheet SU Draw Page Layout Home Insert Formulas Data Review View + Share Calibri (Body) 12 A- A = = General Wrap Text AutoSum ab WE AQ --- H Fill Paste BI U U - , A, Merge & Center $ % ) 4.0 .00 .00 .0 Insert Delete Format Conditional Format Formatting as Table Cell Styles Clear Sort & Filter Find & Select D34 4 fx B D E F G H 1 J K L M N 0 1 SPEND ANALYSIS A - BY ANNUAL DOLLAR 2 3 Part Number Supplier Category Unit Price ANNUAL DOLLAR AMOUNT Annual Usage 75 CUMULATIVE ANNUAL DOLLAR USAGE PERCENTAGE USAGE CLASSIFICATION 4 PERCENTAGE USAGE 30.47 5 7 Repair 30.47 6 25 Chemical 900 48.67 18.21 7.79 7 17 15 1,525.00 75.95 1,950.00 2,400.00 525 56.46 8 16 12 64.14 7.67 A 9 Systematic Onward Systematic Leader Dryell Outward Onward Leader Onward 14 38 69.45 5.31 10 19 300 48 73.29 3.84 11 20 200 62.5 76.62 3.33 12 6 25 450 79.61 3.00 2.7 13 10 12 850 82.33 14 $114,375.00 $182,730.00 $211,980.00 $240,780.00 $260,730.00 $275,130.00 $287,630.00 $298,880.00 $309,080.00 $319,080.00 $326,580.00 $334,080.00 $340,092.50 $345,617.50 $351,017.50 $356,080.00 $361,080.00 $364,855.00 1 $10.00 84.99 2.66 15 $114,375.00 $68,355.00 $29,250.00 $28,800.00 $19,950.00 $14,400.00 $12,500.00 $11,250.00 $10,200.00 $10,000.00 $7,500.00 $7,500.00 $6,012.50 $5,525.00 $5,400.00 $5,062.50 $5,000.00 $3,775.00 $3,125.00 $2,307.50 Smithson Robertson Forward 2 1,000 10,000 10 0.75 86.99 2.00 16 8 750 88.99 2.00 B 17 24 650 90.59 1.60 Repair Facility MRO Chemical Chemical Facility Chemical Mechanical Stationary Automation Chemical Facility Automation Automation Stationary Repair Chemical Electrical Mechanical Production MRO Electrical Production 9.25 85 18 21 65 92.06 1.47 19 18 36 93.50 150 750 1.44 1.35 20 23 6.75 94.85 21 Outward Leader Forward Forward Robertson Systematic Outward Minline Smithson 12 1 96.18 1.33 22 22 75.5 97.19 1.01 5,000 50 2,500 650 23 9 1.25 98.02 0.83 24 15 98.63 0.61 3.55 2.5 25 11 750 99.13 0.50 0.33 3 3 Tennant 500 2.5 $367,980.00 $370,287.50 $372,162.50 $373,412.50 $374,312.50 $375,062.50 $375,418.75 26 27 99.47 4 100 9 99.71 0.24 $1,875.00 $1,250.00 $900.00 $750.00 $356.25 $375,418.75 Dryell Minline 28 5 250 3 99.91 0.20 29 13 Tennant 375 0.95 100.00 0.09 30 31 32 33 34 Given Data A - By Annual Dollar B-By Supplier By Category Sheet7 + Ready . + 100% Spend Analysis Data Q- Search Sheet os 5- Insert Draw Page Layout Home Formulas Data Review View + Share Calibri (Body) 12 A- A+ AutoSum , DO Wrap Text General . H 49. Q: WOO Fill A Paste B I U U- Merge & Center $ % % ) 4.0 .00 .00 1.0 Insert Delete Format Conditional Format Cell Formatting as Table Styles Clear Sort & Filter Find & Select L33 fx 1 2 3 B D E F G H 1 J K L M N o P Q R S 1 SPEND ANALYSIS BY SUPPLIER 2 3 Part Number Supplier Annual Usage Unit Price ANNUAL DOLLAR AMOUNT CUMULATIVE ANNUAL DOLLAR USAGE PERCENTAGE USAGE CLASSIFICATIO N 4 8 Systematic Total Onward Total 12 39.26 24.25 12.14 16 $147,400.00 $238,455.00 $284,030.00 $307,567.50 $328,417.50 20 Leader Total Outward Total Dryell Total Forward Total 6.271 23 5.55 + $147,400.00 $91,055.00 $45,575.00 $23,537.50 $20,850.00 $17,962.50 $12,500.00 $11,875.00 $3,057.50 $1,606.25 $375,418.75 27 $346,380.00 B 4.78 + 30 3.33 + 33 $358,880.00 $370,755.00 $373,812.50 $375,418.75 + Robertson Total Smithson Total Minline Total Tennant Total Grand Total 36 3.16 0.81 0.43 + 39 40 41 42 1 43 44 45 46 47 13 48 o 49 50 51 . 52 1 53 54 55 56 57 58 En Given Data A - By Annual Dollar B-By Supplier By Category Sheet7 + Ready B + 100% Spend Analysis Data Q- Search Sheet 5 Draw Home Insert Page Layout Formulas Data Review View 2+ Share Calibri (Body) - 12 A- A A- AutoSum General Wrap Text X WE 49. Q Fill Paste B I A = = = =" Merge & Center $ % % ) 2.0 .00 ,00 0 Insert Delete Format Conditional Format Cell Formatting as Table Styles Clear Sort & Filter Find & Select D45 foc 1 2 3 A B D E F G H 1 j K L L M N o P 1 SPEND ANALYSIS BY CATEGORY 2 3 Part Number Supplier Category Annual Usage Unit Price ANNUAL DOLLAR AMOUNT CLASSIFICATION PERCENTAGE USAGE 4 8 39.26 $147,400.00 $114,592.50 A 15 30.52 A 19 12.14 + 22 CUMULATIVE ANNUAL DOLLAR USAGE $147,400.00 $261,992.50 $307,567.50 $328,417.50 $346,380.00 $358,880.00 $370,755.00 $373,812.50 $375,418.1 5.55 (+ + + + + + + + + + 26 4.78 Repair Total Chemical Total Facility Total MRO Total Automation Total Stationary Total Mechanical Total Electrical Total Production Total Grand Total B $45,575.00 $20,850.00 $17,962.50 $12,500.00 $11,875.00 $3,057.50 + 29 3.33 32 3.16 + 35 0.81 + 38 0.43 $1,606.25 $375,418.75 39 40 41 42 43 44 45 46 47 48 49 50 51 52 53 54 55 56 57 58 Given Data A - By Annual Dollar B - By Supplier By Category Sheet7 + Ready + 100%Step by Step Solution
There are 3 Steps involved in it
1 Expert Approved Answer
Step: 1 Unlock

Question Has Been Solved by an Expert!
Get step-by-step solutions from verified subject matter experts
Step: 2 Unlock
Step: 3 Unlock