

Question: Question 1: Year 5 6 7 8 10 Demand 7 5 9 13 8 12 13 9 11 a) Plot the above data on a
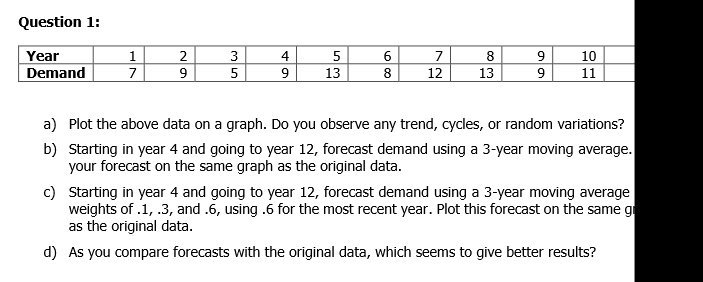
Question 1: Year 5 6 7 8 10 Demand 7 5 9 13 8 12 13 9 11 a) Plot the above data on a graph. Do you observe any trend, cycles, or random variations? b) Starting in year 4 and going to year 12, forecast demand using a 3-year moving average. your forecast on the same graph as the original data. c) Starting in year 4 and going to year 12, forecast demand using a 3-year moving average weights of .1, .3, and .6, using .6 for the most recent year. Plot this forecast on the same g as the original data. d) As you compare forecasts with the original data, which seems to give better results
Step by Step Solution
There are 3 Steps involved in it
1 Expert Approved Answer
Step: 1 Unlock

Question Has Been Solved by an Expert!
Get step-by-step solutions from verified subject matter experts
Step: 2 Unlock
Step: 3 Unlock