

Question: Question 10: answer everything please 10. Properties of a confidence interval Suppose the mean of a population is u = 61. A researcher (who does
Question 10: answer everything please

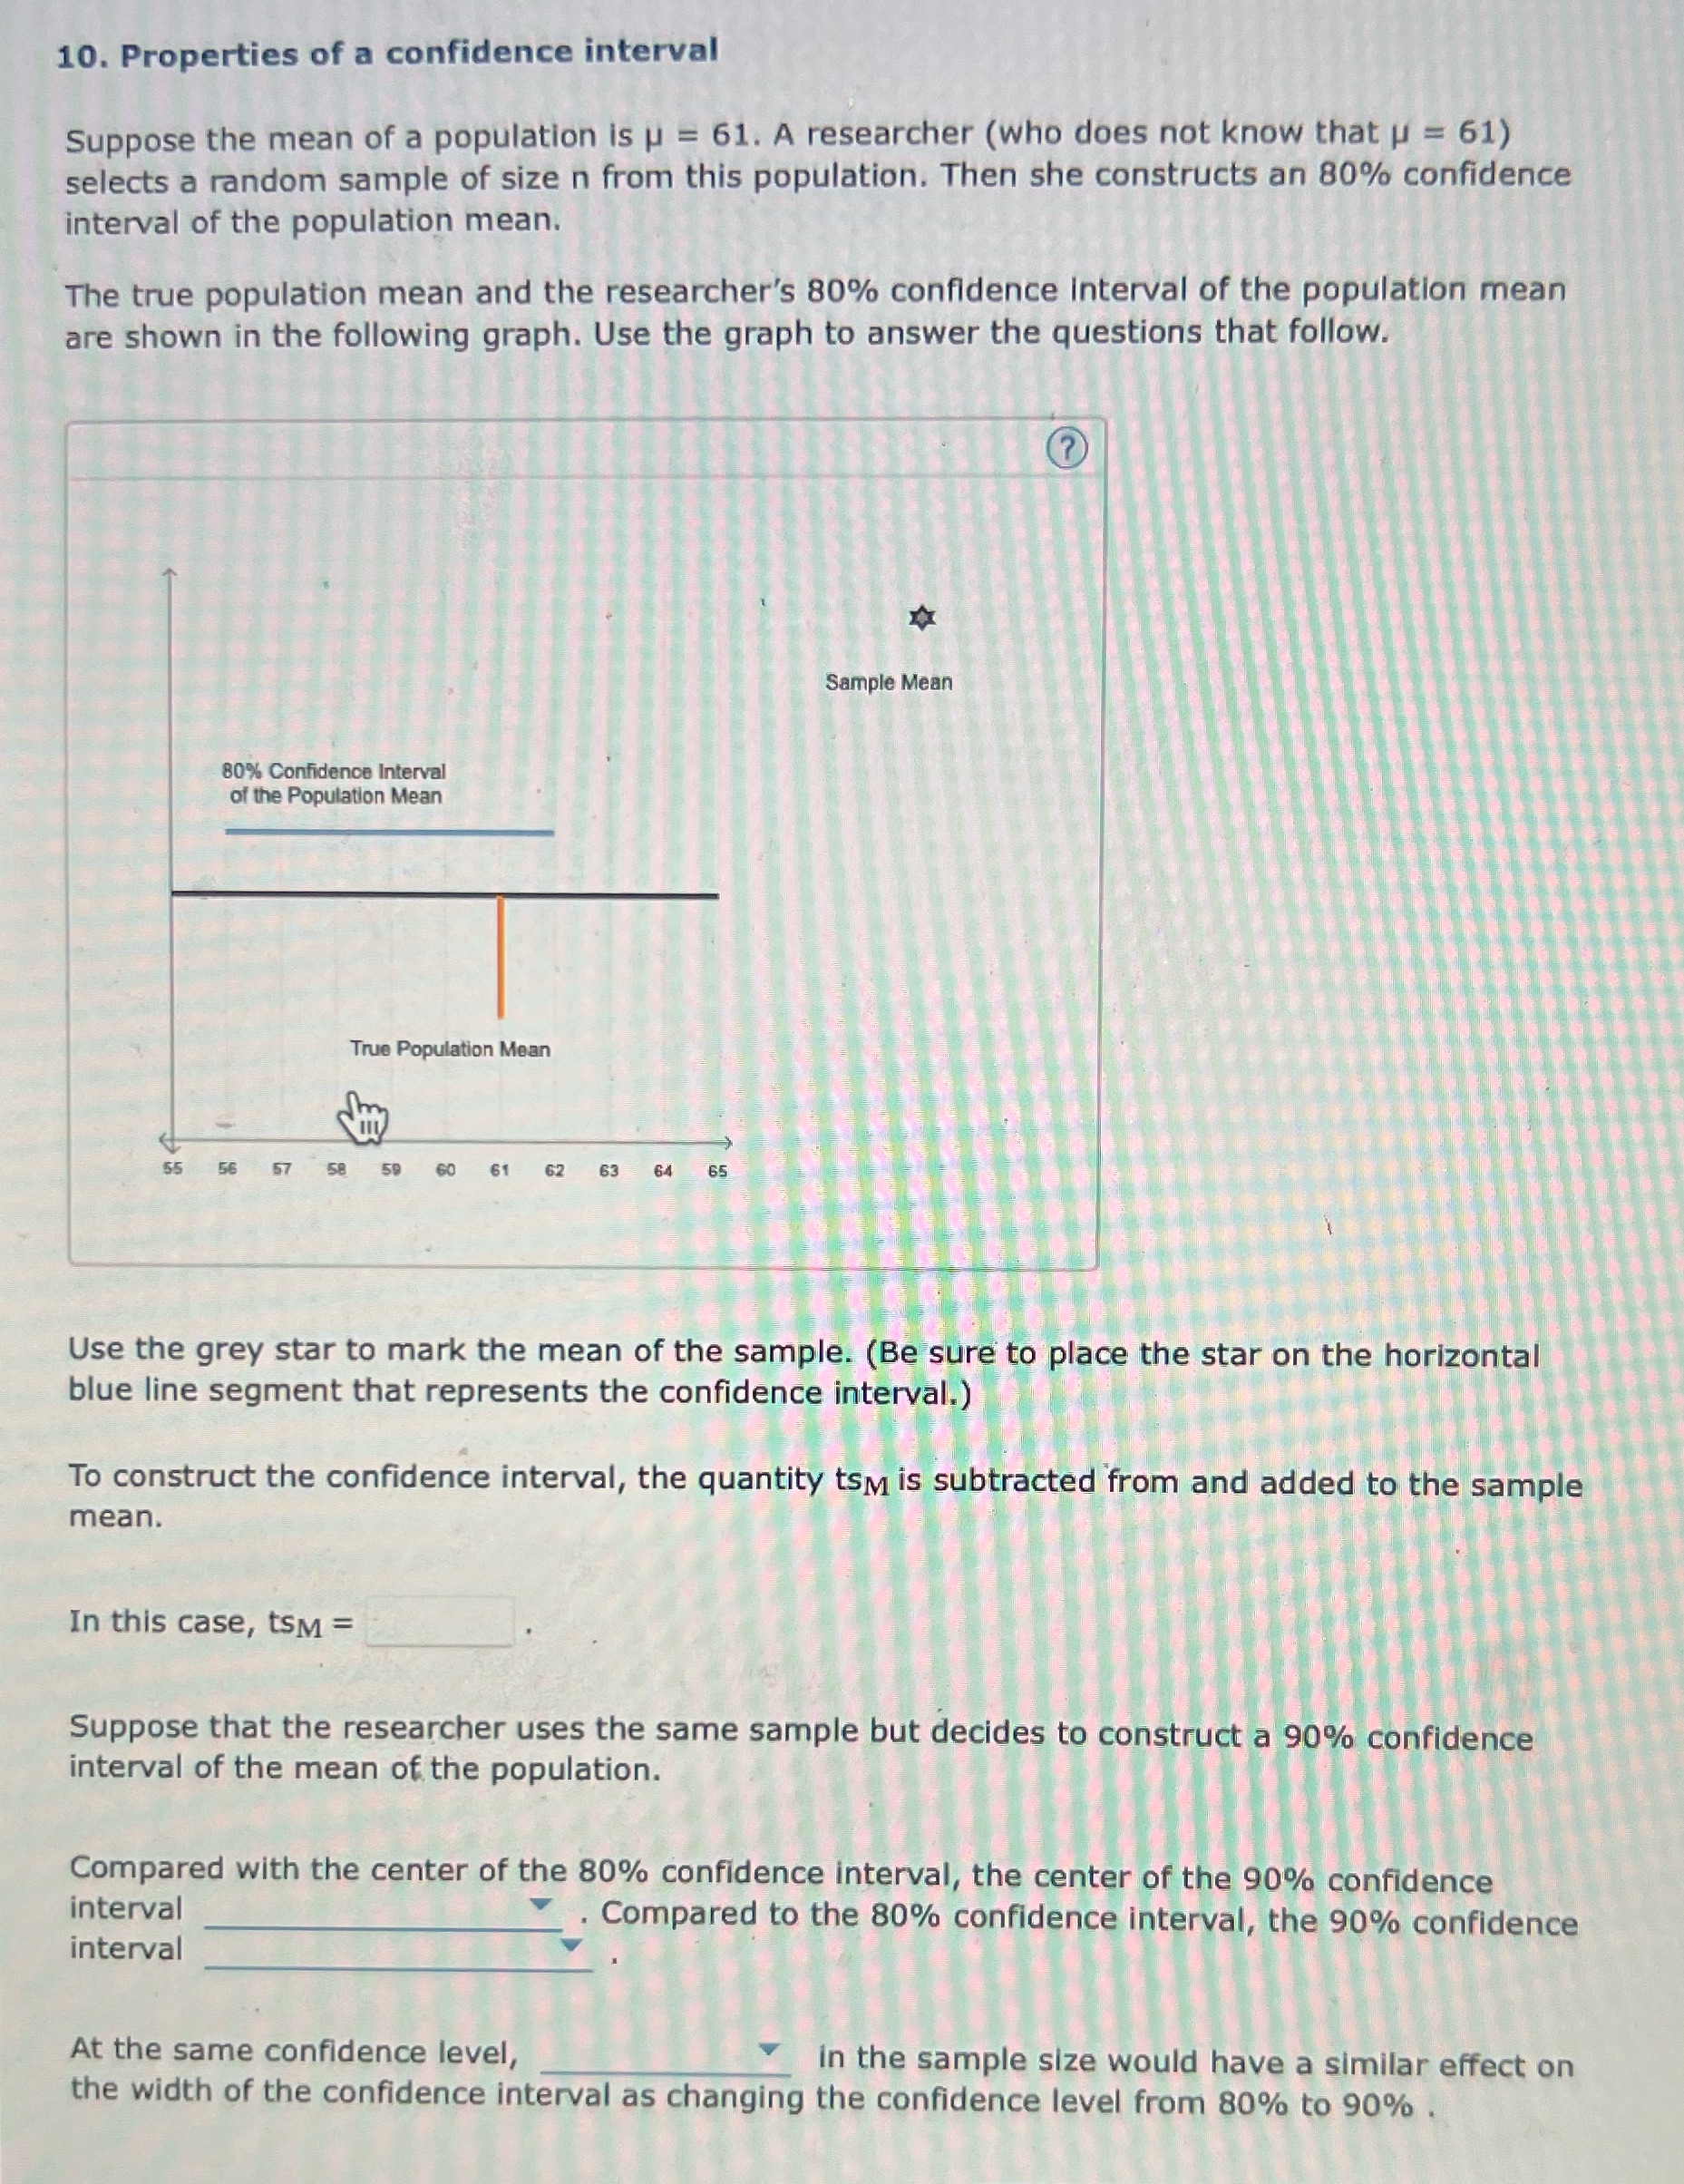
10. Properties of a confidence interval Suppose the mean of a population is u = 61. A researcher (who does not know that ( = 61) selects a random sample of size n from this population. Then she constructs an 80% confidence interval of the population mean. The true population mean and the researcher's 80% confidence interval of the population mean are shown in the following graph. Use the graph to answer the questions that follow. Sample Mean 80% Confidence Interval of the Population Mean True Population Mean 58 50 60 61 62 64 65 Use the grey star to mark the mean of the sample. (Be sure to place the star on the horizontal blue line segment that represents the confidence interval.) To construct the confidence interval, the quantity tsm is subtracted from and added to the sample mean. In this case, tsM = Suppose that the researcher uses the same sample but decides to construct a 90% confidence interval of the mean of the population. Compared with the center of the 80% confidence interval, the center of the 90% confidence interval . Compared to the 80% confidence interval, the 90% confidence interval At the same confidence level, in the sample size would have a similar effect on the width of the confidence interval as changing the confidence level from 80% to 90%
Step by Step Solution
There are 3 Steps involved in it

Get step-by-step solutions from verified subject matter experts