

Question: Question 10 Frequency Here again is the histogram showing the distribution of 50 ages at death due to trauma accidents and homicides that occurred in

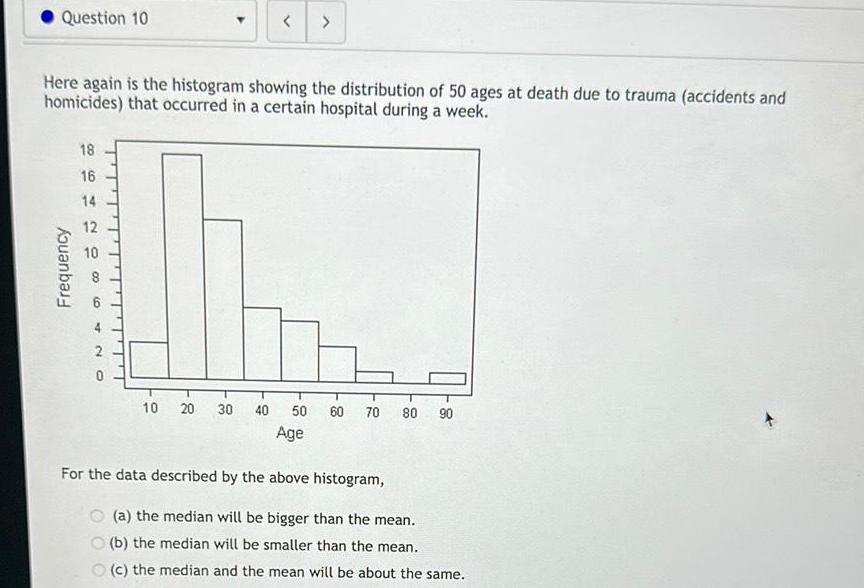
Question 10 Frequency Here again is the histogram showing the distribution of 50 ages at death due to trauma accidents and homicides that occurred in a certain hospital during a week 18 16 14 208642 12 10 20 30 40 T 50 Age 60 70 80 90 For the data described by the above histogram a the median will be bigger than the mean b the median will be smaller than the mean c the median and the mean will be about the same
Step by Step Solution
There are 3 Steps involved in it
1 Expert Approved Answer
Step: 1 Unlock

Question Has Been Solved by an Expert!
Get step-by-step solutions from verified subject matter experts
Step: 2 Unlock
Step: 3 Unlock