

Question: Question 10 Histogram1.pdf For the table below: a) List, separating with commas the relative frequency of each one of the classes. Use decimals with two
Question 10
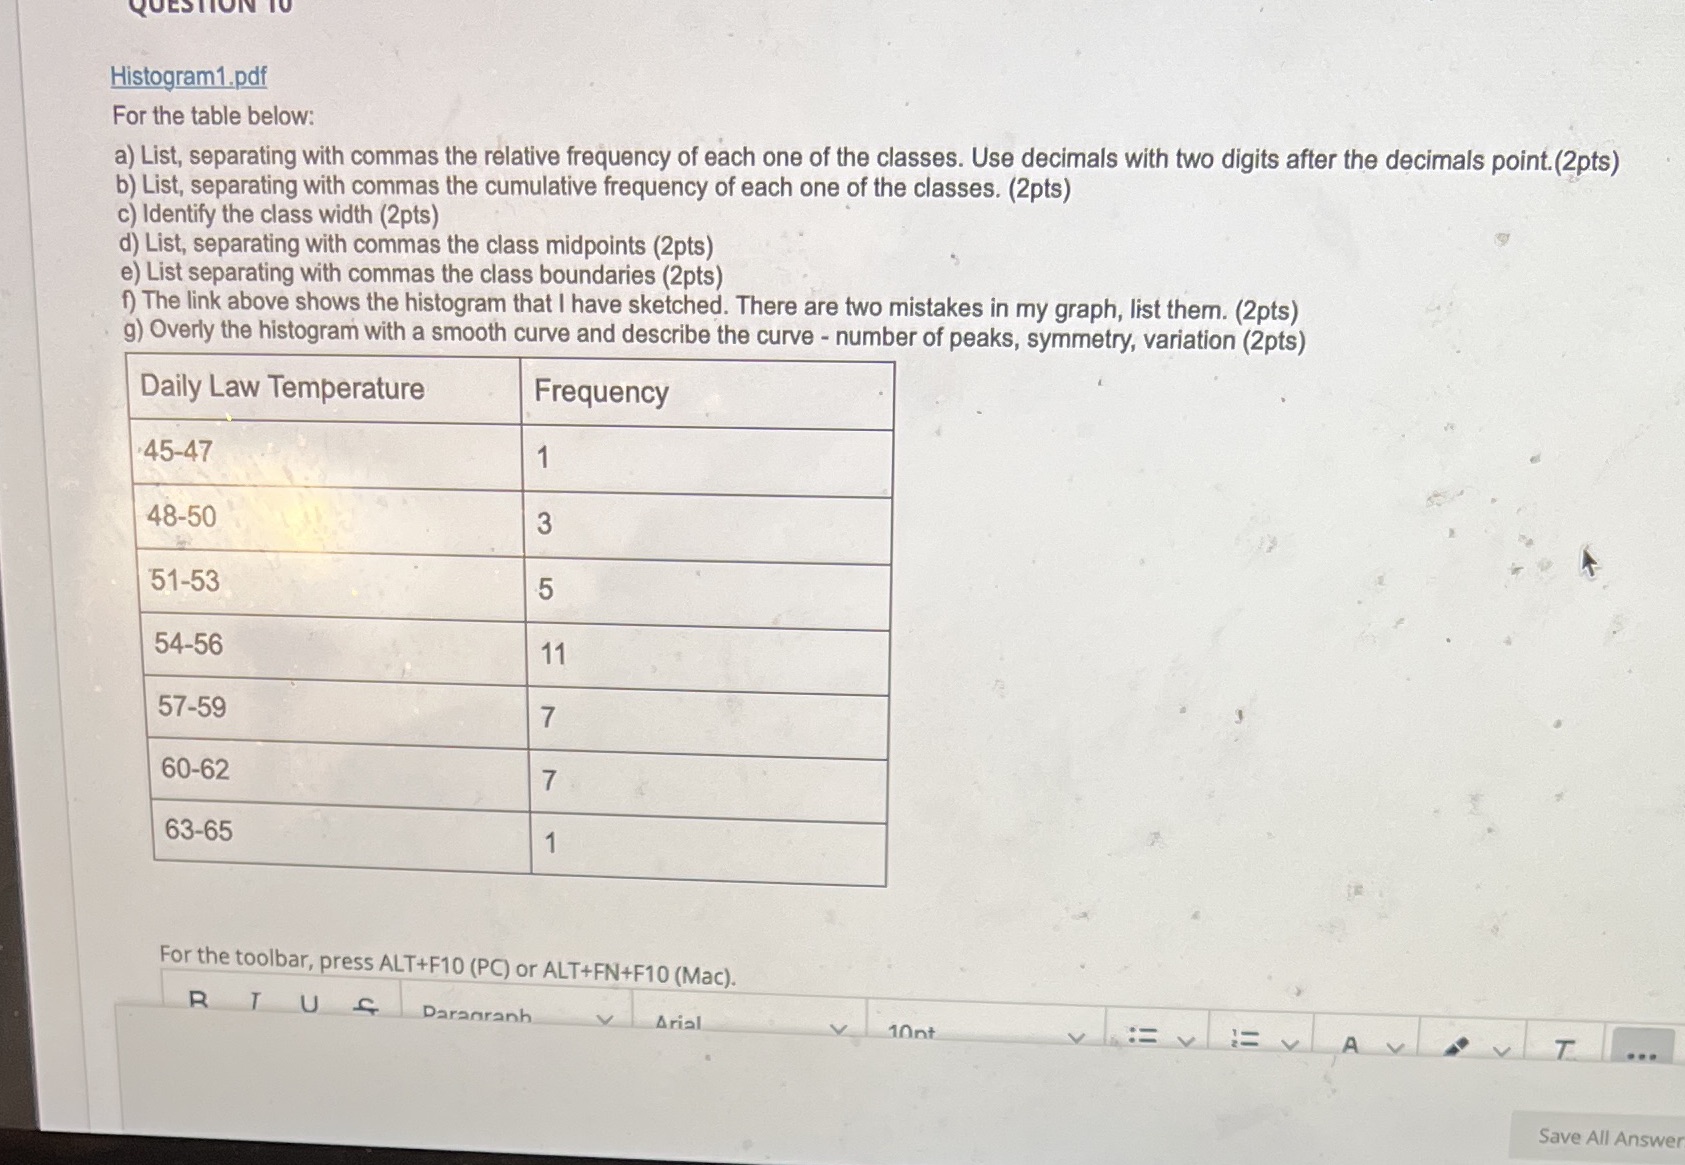
Histogram1.pdf For the table below: a) List, separating with commas the relative frequency of each one of the classes. Use decimals with two digits after the decimals point. (2pts) b) List, separating with commas the cumulative frequency of each one of the classes. (2pts) c) Identify the class width (2pts) d) List, separating with commas the class midpoints (2pts) e) List separating with commas the class boundaries (2pts) () The link above shows the histogram that I have sketched. There are two mistakes in my graph, list them. (2pts) g) Overly the histogram with a smooth curve and describe the curve - number of peaks, symmetry, variation (2pts) Daily Law Temperature Frequency 45-47 48-50 3 51-53 5 54-56 11 57-59 7 60-62 7 63-65 1 For the toolbar, press ALT+F10 (PC) or ALT+FN+F10 (Mac). RT US Paragraph v Arial 10nt VEVEVAVDV T ... Save All
Step by Step Solution
There are 3 Steps involved in it

Get step-by-step solutions from verified subject matter experts