

Question: Question 10 Using the data above (vou can download this from the posted assignment, titled midterm_hockey b.csv), for the folowing questions. Your answer should include
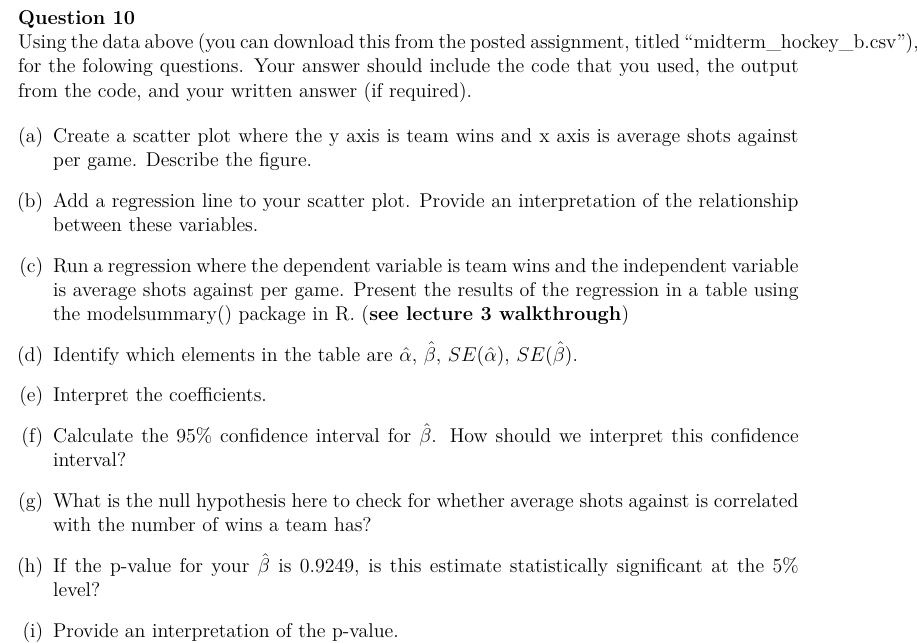
Question 10 Using the data above (vou can download this from the posted assignment, titled \"midterm_hockey b.csv), for the folowing questions. Your answer should include the code that you used, the output from the code, and your written answer (if required). (a) Create a scatter plot where the v axis is team wins and x axis is average shots against per game. Describe the figure. (b) Add a regression line to your scatter plot. Provide an interpretation of the relationship between these variables. () Run a regression where the dependent variable is team wins and the independent variable is average shots against per game. Present the results of the regression in a table using the modelsummary() package in R. (see lecture 3 walkthrough) (d) Identify which elements in the table are &, 8, SE (&), SE (5'] (e) Interpret the coefficients. (f) Calculate the 95% confidence interval for 3. How should we interpret this confidence interval? (g) What is the null hypothesis here to check for whether average shots against is correlated with the number of wins a team has? (h) If the p-value for your ,t'? is 0.9249, is this estimate statistically significant at the 5% level? (i) Provide an interpretation of the p-value
Step by Step Solution
There are 3 Steps involved in it

Get step-by-step solutions from verified subject matter experts