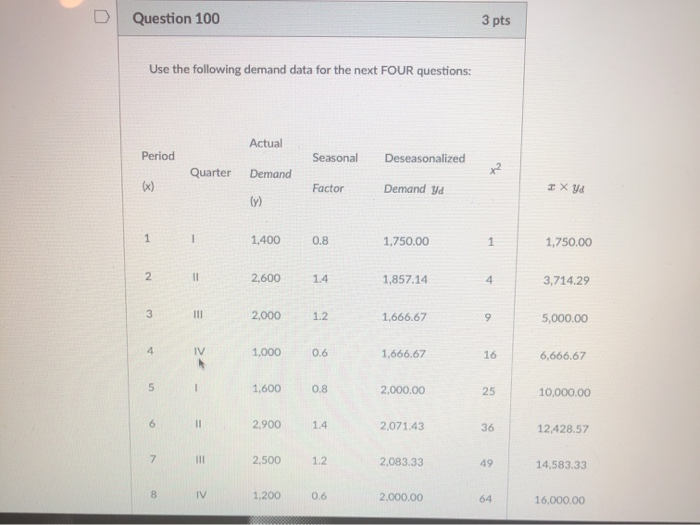
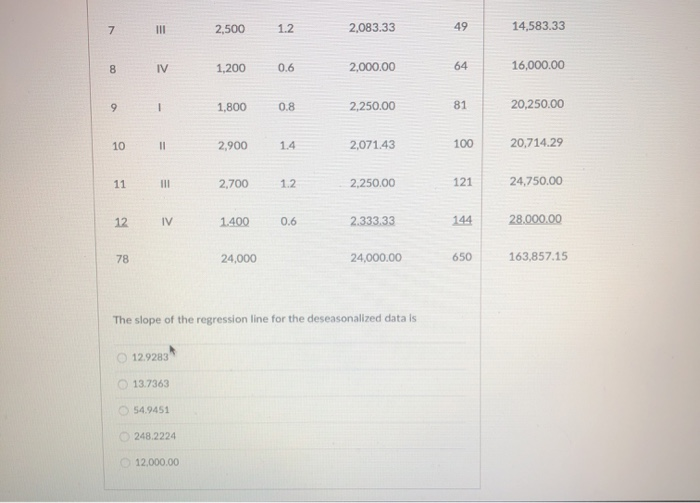
Question: Question 100 3 pts Use the following demand data for the next FOUR questions: Actual Period Seasonal Deseasonalized Quarter Demand x2 (x) Factor Demand ya

Question 100 3 pts Use the following demand data
Question 100 3 pts Use the following demand data for the next FOUR questions: Actual Period Seasonal Deseasonalized Quarter Demand x2 (x) Factor Demand ya IXY ly) 1 1,400 0.8 1.750.00 1 1,750.00 2 11 2,600 1.4 1,857.14 4 3,714.29 3 HII 2,000 1.2 1,666.67 9 5,000.00 4 IV 1,000 0.6 1,666.67 16 6,666.67 5 1 1,600 0.8 2,000.00 25 10,000.00 6 11 2.900 1.4 2,071.43 36 12,428.57 7 = 2.500 1.2 2.083.33 49 14,583.33 8 IV 1.200 0.6 2.000.00 64 16,000.00 7 III 2,500 1.2 2,083.33 49 14,583.33 IV 1,200 00 0.6 2,000.00 64 16,000.00 9 1 1,800 0.8 2.250.00 81 20,250.00 10 11 2,900 1.4 2,071.43 100 20,714.29 11 2,700 1.2 2.250.00 121 24,750.00 12 IV 1.400 0.6 2.333.33 144 28.000.00 78 24,000 24,000.00 650 163,857.15 The slope of the regression line for the deseasonalized data is 12.9283 13.7363 54.9451 248.2224 12,000.00 Question 101 3 pts The intercept of the regression line for the deseasonalized data is 0 -76,000.0 O 386.5544 1642.8568 1910.7141 1915.9661 U Question 102 3 pts The value predicted in period 13 by the regression line (for deseasonaltzed data) is 554.6219 565.1263 727.2147 1100,8407 2357.1432 Question 103 3 pts The seasonally-adjusted forecast for period 13 is 443.6978 1885.7145 2214.2859 3300.0005 3895.7984

Step by Step Solution

There are 3 Steps involved in it

1 Expert Approved Answer
Step: 1 Unlock blur-text-image
Question Has Been Solved by an Expert!

Get step-by-step solutions from verified subject matter experts

Step: 2 Unlock
Step: 3 Unlock

Students Have Also Explored These Related General Management Questions!