

Question: Question 11 (1 point) Saved Using the tests.dta dataset, determine the line that best describes the linear relationship between self-confidence score (Y-variable) and social adjustment
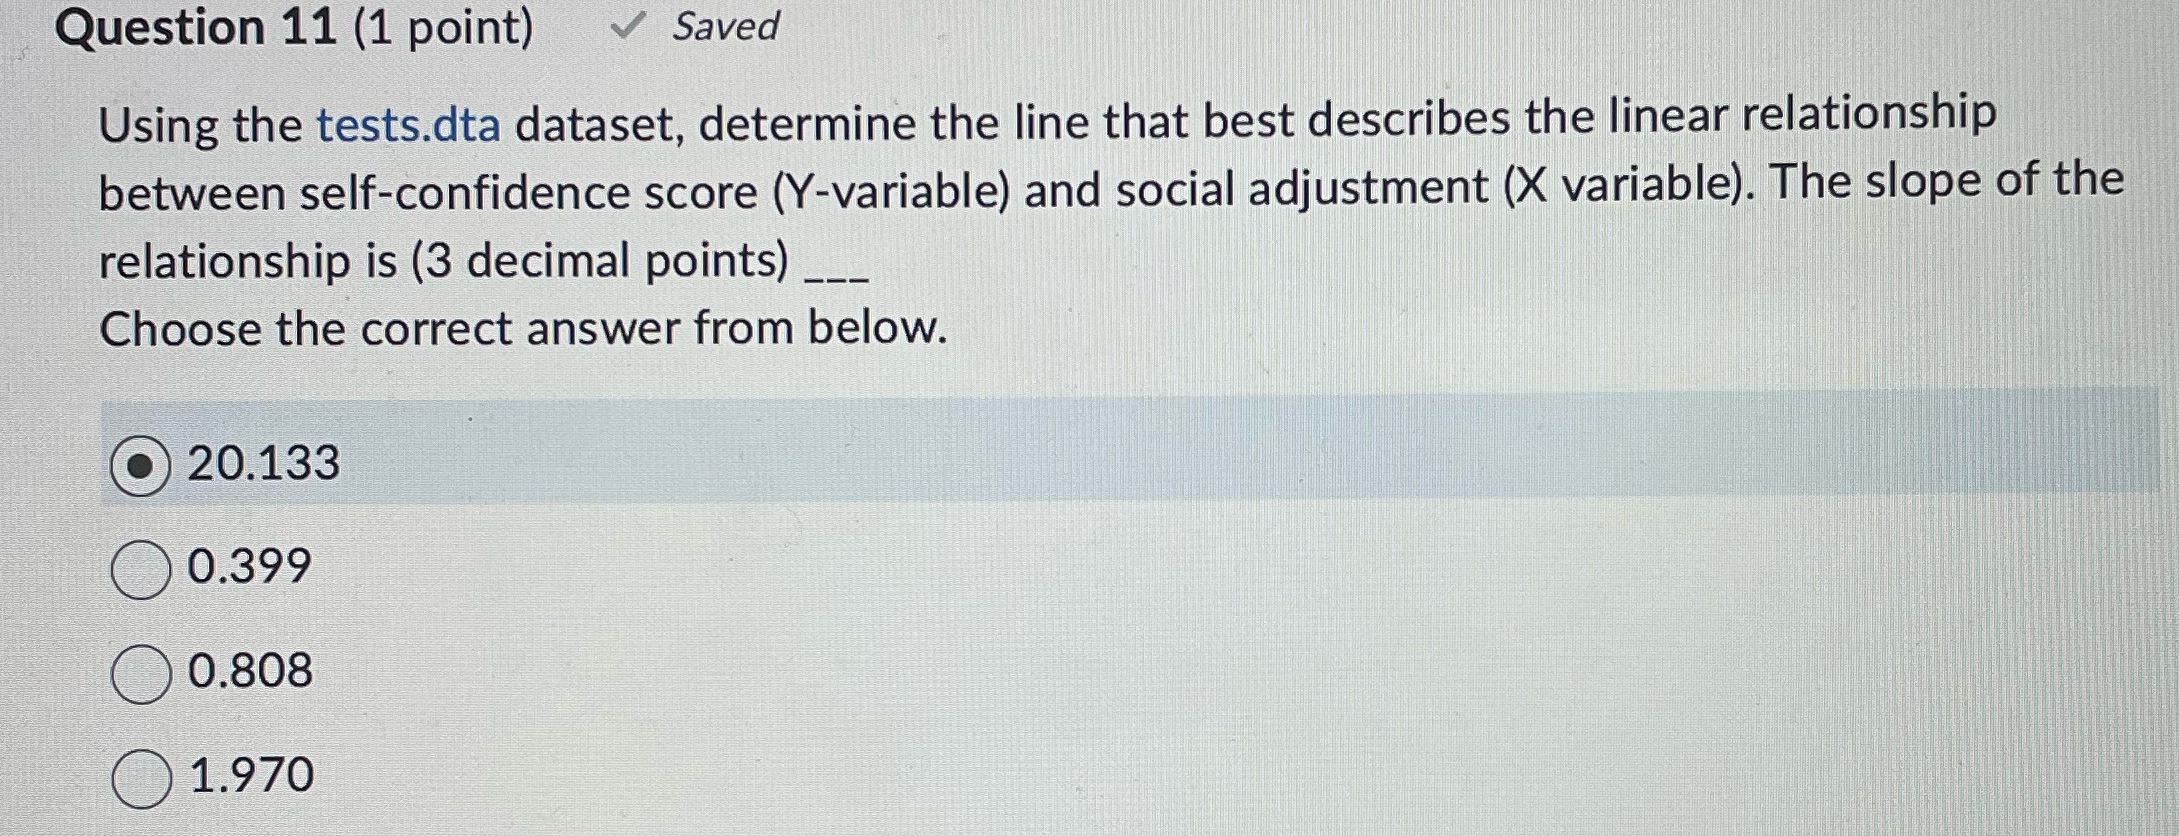

Question 11 (1 point) Saved Using the tests.dta dataset, determine the line that best describes the linear relationship between self-confidence score (Y-variable) and social adjustment (X variable). The slope of the relationship is (3 decimal points) Choose the correct answer from below. 20.133 0.399 0.808 O 1.970
Step by Step Solution
There are 3 Steps involved in it
1 Expert Approved Answer
Step: 1 Unlock

Question Has Been Solved by an Expert!
Get step-by-step solutions from verified subject matter experts
Step: 2 Unlock
Step: 3 Unlock