

Question: this is statistics course and I need help with answering these questions. I attached formulas in case you can use it as a reference.Thank you
this is statistics course and I need help with answering these questions. I attached formulas in case you can use it as a reference.Thank you
![you II. Probability PM U B) = PM) + P(B] Pull n](https://dsd5zvtm8ll6.cloudfront.net/si.experts.images/questions/2024/09/66f6ef705668b_18466f6ef70335ff.jpg)
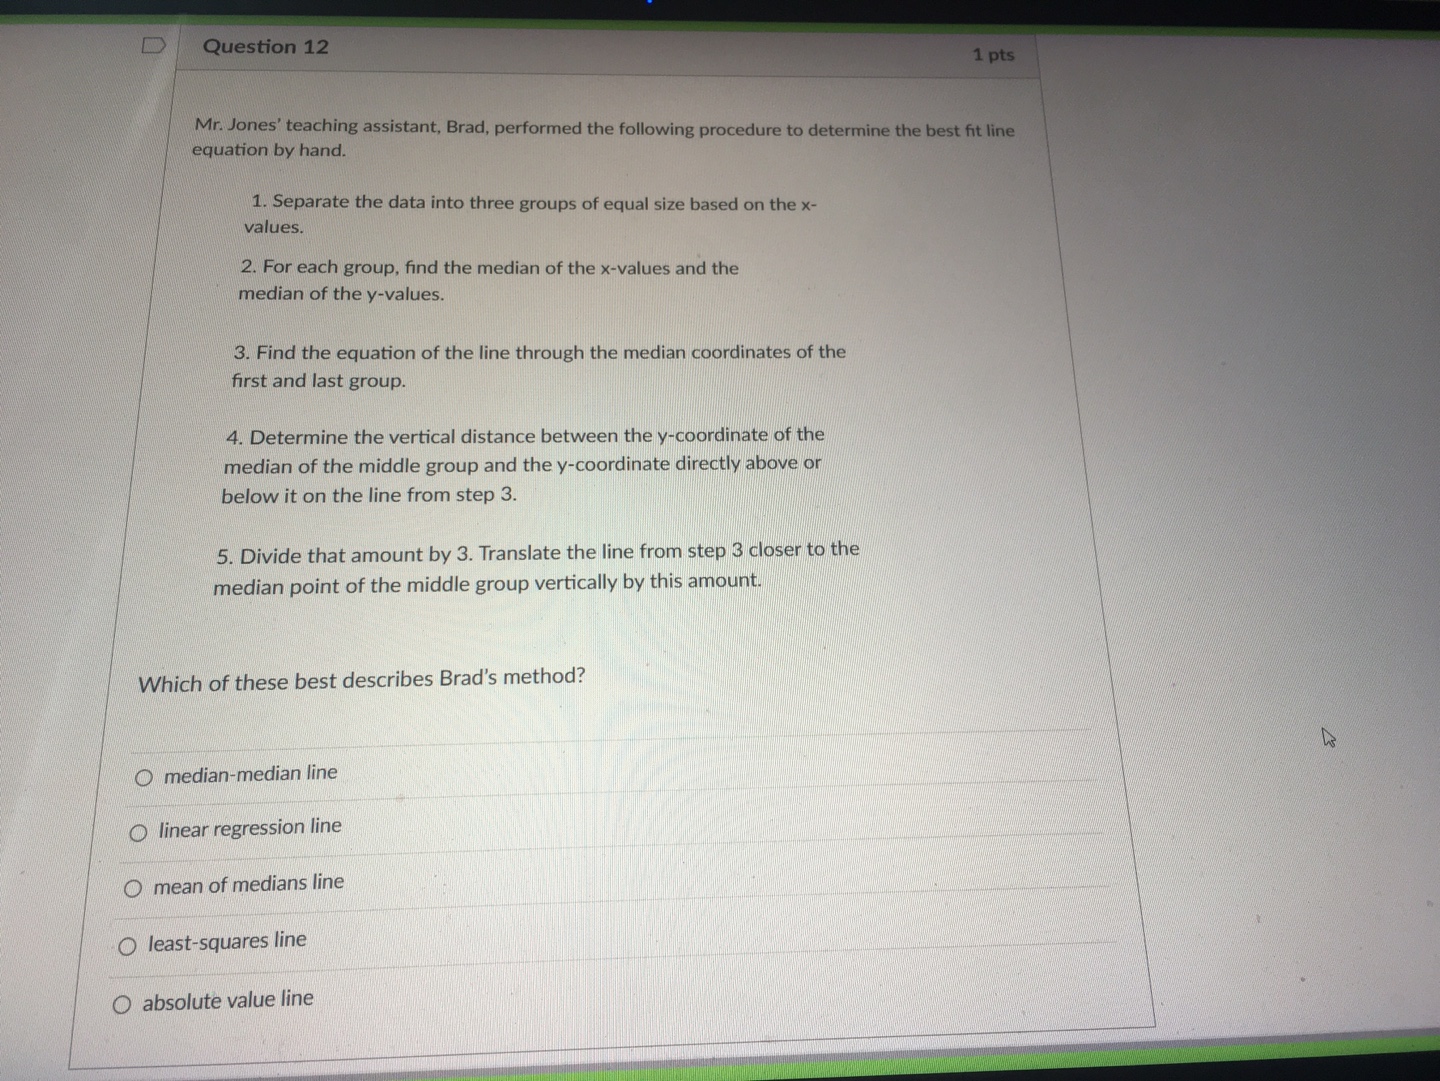
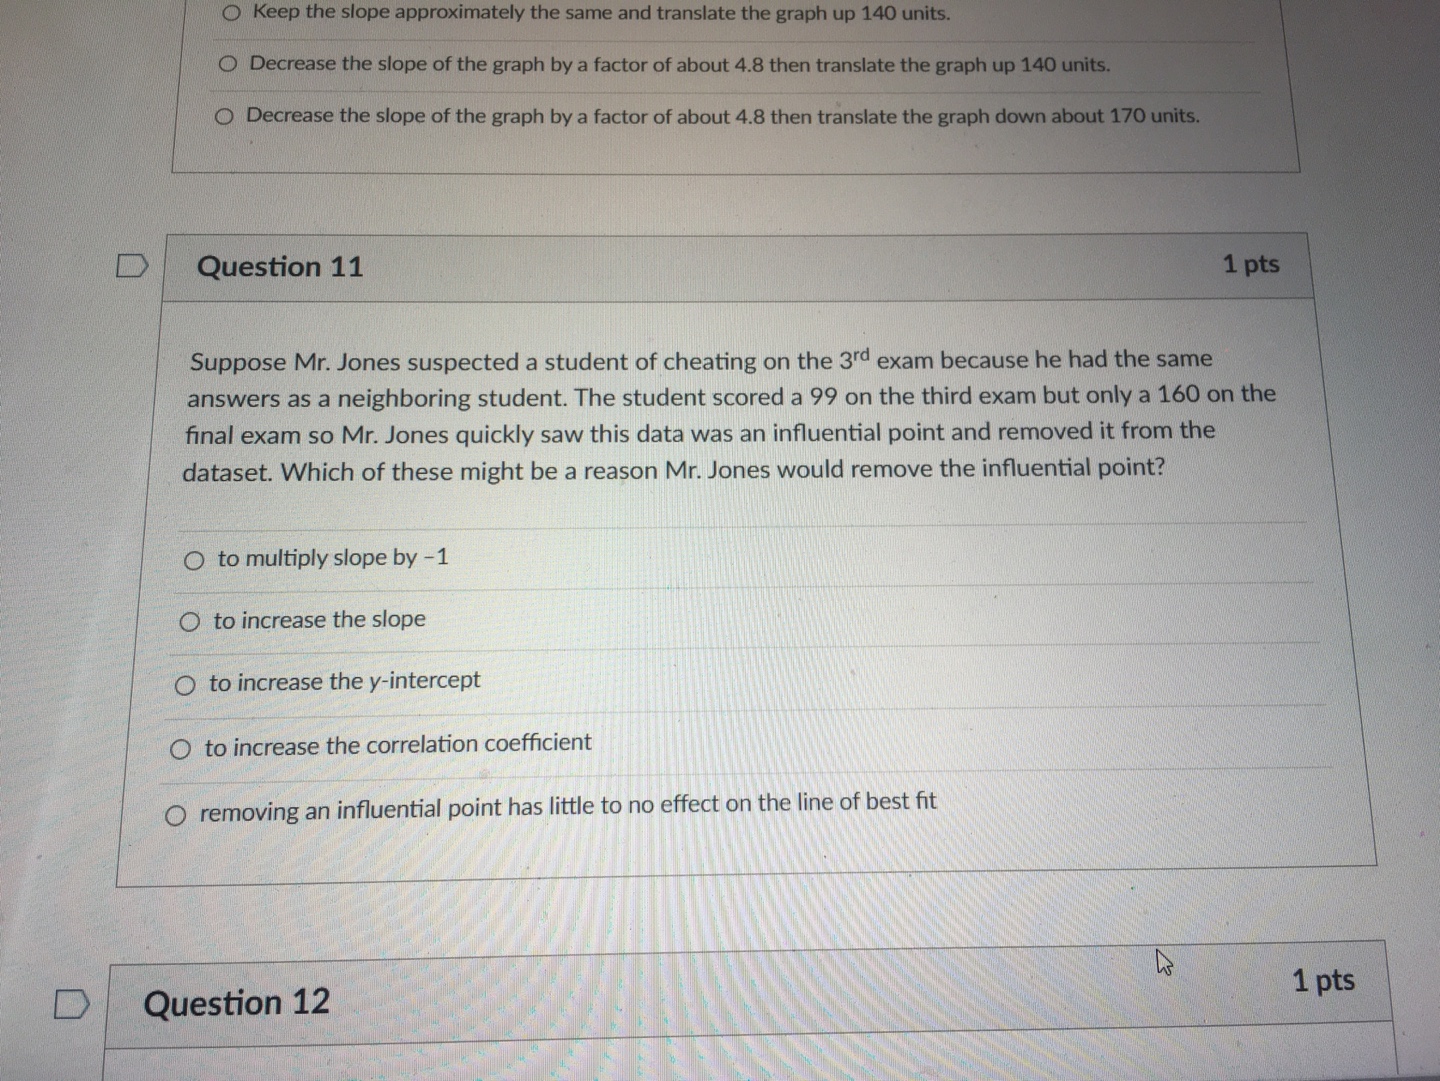
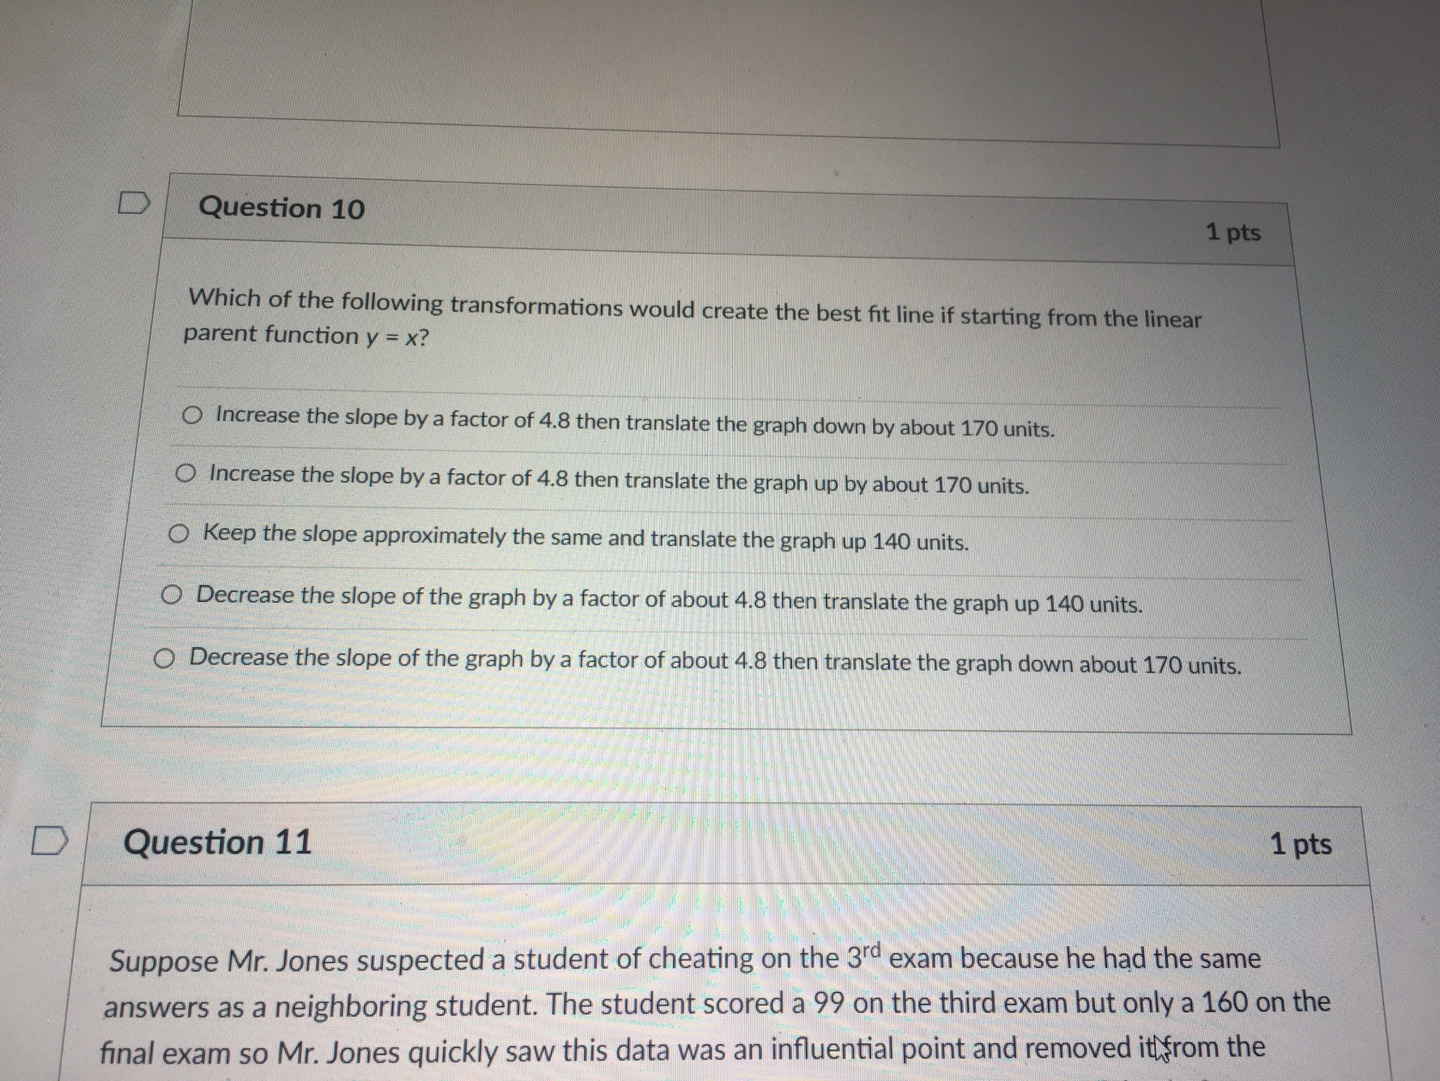
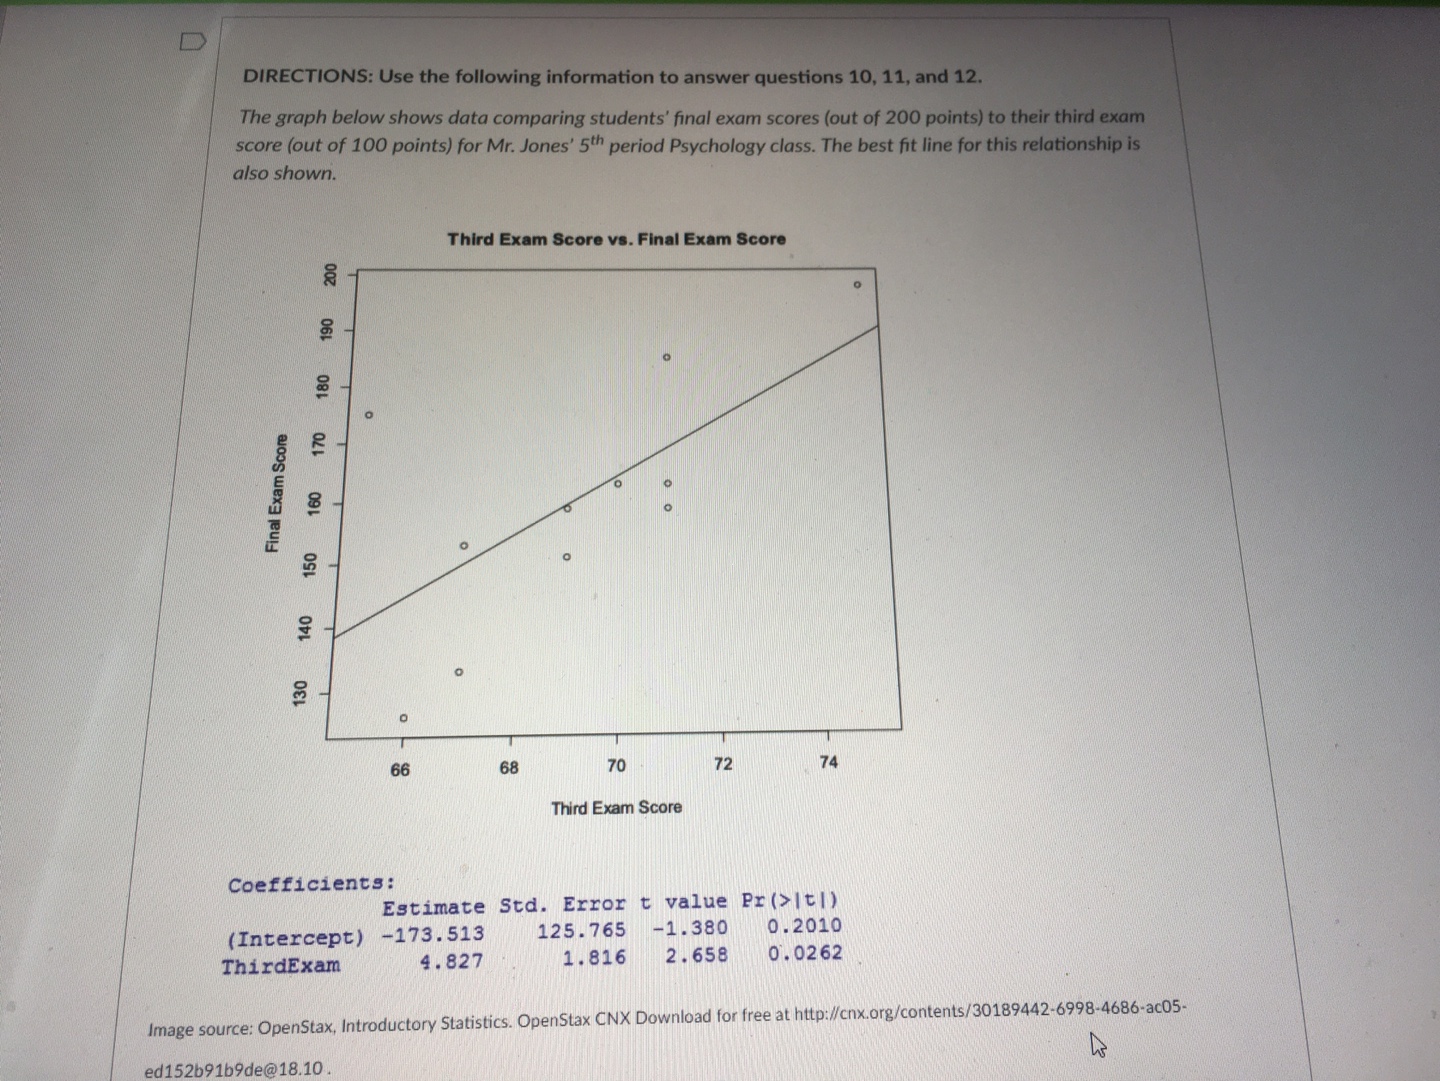
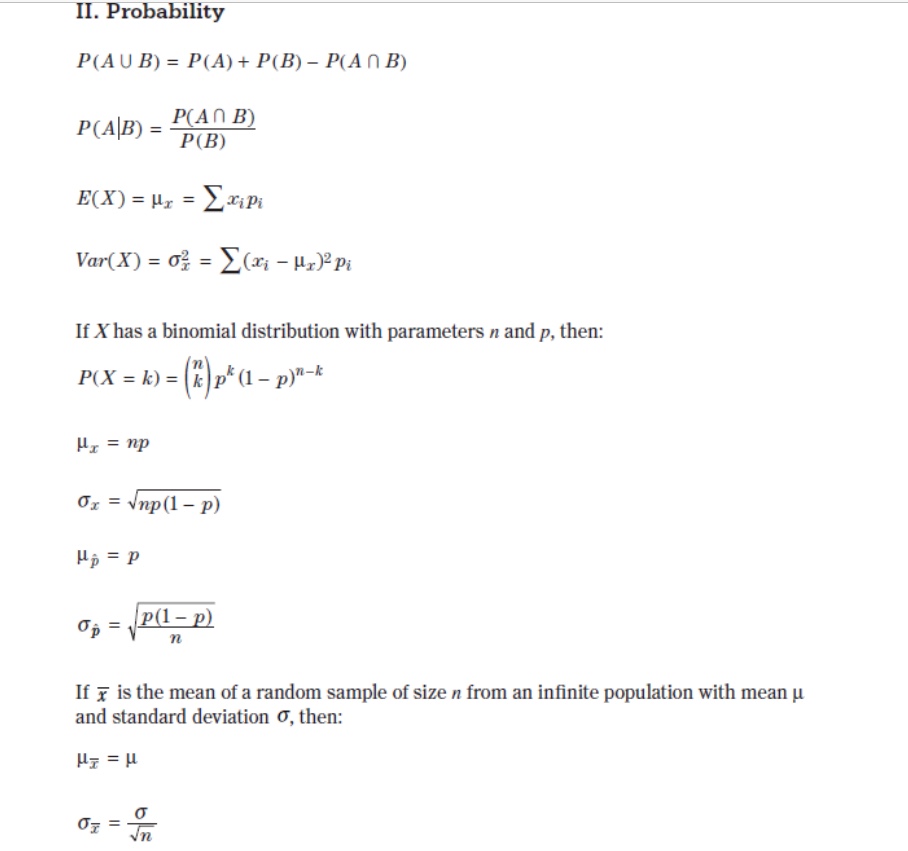
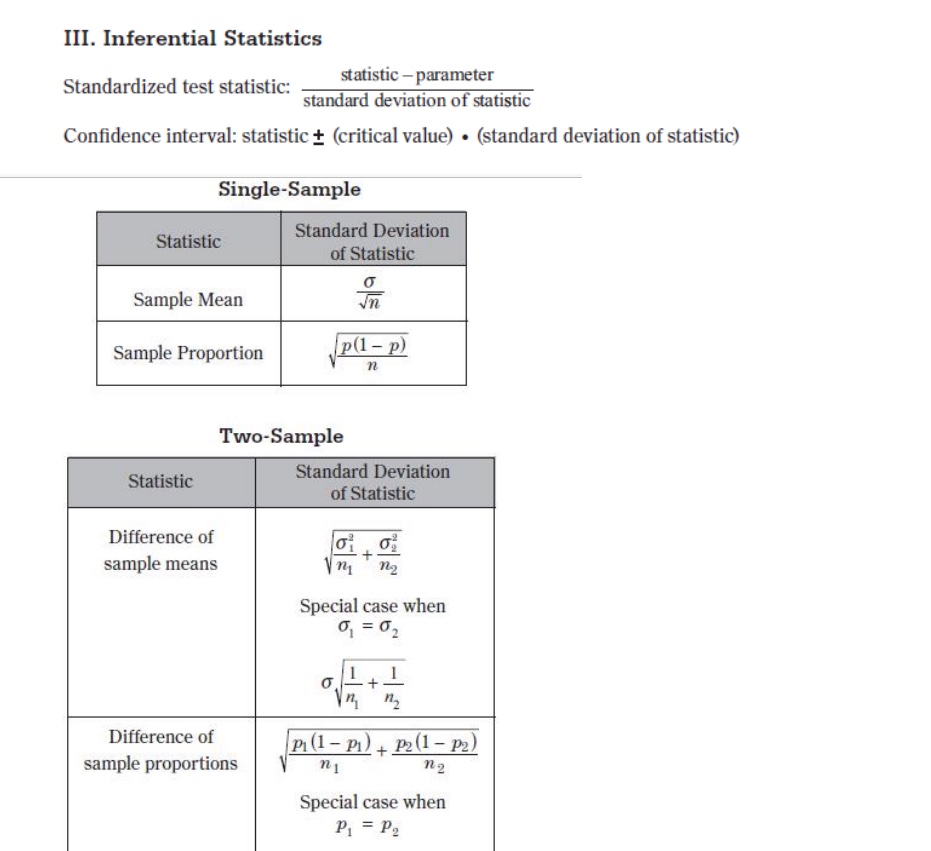
II. Probability PM U B) = PM) + P(B] Pull n B) m = Lag?) Var-(X) = 0% = 2m 11:39-19: If X has a binomial distribution with parameters :1 and p, then: P(X = k) = (:)pt(1_ 13)": \"3:74!\" If E la the mean ofa random sample ofsize n from an innite population with mean p and standard deviation 0', then: T 0' \"i=7: III. Inferential Statistics Standardized test statistic: statistic - parameter standard deviation of statistic Confidence interval: statistic + (critical value) . (standard deviation of statistic) Single-Sample Statistic Standard Deviation of Statistic Sample Mean Sample Proportion p(1 - p) n Two-Sample Statistic Standard Deviation of Statistic Difference of sample means n2 Special case when 0 =02 Difference of P (1 - PI) + P2 (1 - P2) sample proportions n 1 n2 Special case when P = P2\fD Question 12 1 pts Mr. Jones' teaching assistant, Brad, performed the following procedure to determine the best fit line equation by hand. 1. Separate the data into three groups of equal size based on the x- values. 2. For each group, find the median of the x-values and the median of the y-values. 3. Find the equation of the line through the median coordinates of the first and last group. 4. Determine the vertical distance between the y-coordinate of the median of the middle group and the y-coordinate directly above or below it on the line from step 3. 5. Divide that amount by 3. Translate the line from step 3 closer to the median point of the middle group vertically by this amount. Which of these best describes Brad's method? median-median line linear regression line mean of medians line least-squares line O absolute value lineKeep the slope approximately the same and translate the graph up 140 units. O Decrease the slope of the graph by a factor of about 4.8 then translate the graph up 140 units. Decrease the slope of the graph by a factor of about 4.8 then translate the graph down about 170 units. D Question 11 1 pts Suppose Mr. Jones suspected a student of cheating on the 3'd exam because he had the same answers as a neighboring student. The student scored a 99 on the third exam but only a 160 on the final exam so Mr. Jones quickly saw this data was an influential point and removed it from the dataset. Which of these might be a reason Mr. Jones would remove the influential point? O to multiply slope by - 1 to increase the slope to increase the y-intercept to increase the correlation coefficient O removing an influential point has little to no effect on the line of best fit D Question 12 1 ptsD Question 10 1 pts Which of the following transformations would create the best fit line if starting from the linear parent function y = x? Increase the slope by a factor of 4.8 then translate the graph down by about 170 units. O Increase the slope by a factor of 4.8 then translate the graph up by about 170 units. Keep the slope approximately the same and translate the graph up 140 units. Decrease the slope of the graph by a factor of about 4.8 then translate the graph up 140 units. O Decrease the slope of the graph by a factor of about 4.8 then translate the graph down about 170 units. D Question 11 1 pts Suppose Mr. Jones suspected a student of cheating on the 3'd exam because he had the same answers as a neighboring student. The student scored a 99 on the third exam but only a 160 on the final exam so Mr. Jones quickly saw this data was an influential point and removed it from theD DIRECTIONS: Use the following information to answer questions 10, 11, and 12. The graph below shows data comparing students' final exam scores (out of 200 points) to their third exam score (out of 100 points) for Mr. Jones' 5th period Psychology class. The best fit line for this relationship is also shown. Third Exam Score vs. Final Exam Score 200 190 180 170 Final Exam Score 160 150 140 130 66 68 70 72 74 Third Exam Score Coefficients : Estimate Std. Error t value Pr (>It|) (Intercept) -173. 513 125. 765 -1. 380 0 . 2010 ThirdExam 4. 827 1. 816 2. 658 0. 0262 Image source: OpenStax, Introductory Statistics. OpenStax CNX Download for free at http://cnx.org/contents/30189442-6998-4686-ac05- ed152b91b9de@18.10
Step by Step Solution
There are 3 Steps involved in it

Get step-by-step solutions from verified subject matter experts