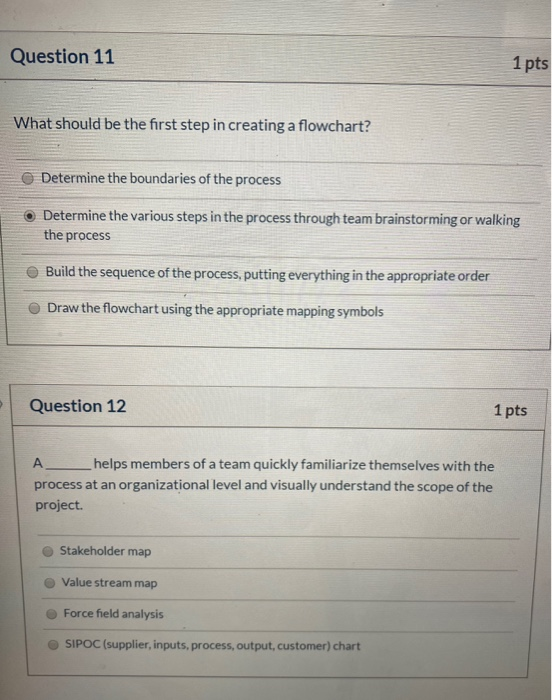
Question: Question 11 1 pts What should be the first step in creating a flowchart? Determine the boundaries of the process Determine the various steps in

Question 11 1 pts What should be the first step

Question 11 1 pts What should be the first step

Question 11 1 pts What should be the first step

Question 11 1 pts What should be the first step

Question 11 1 pts What should be the first step

Question 11 1 pts What should be the first step

Question 11 1 pts What should be the first step in creating a flowchart? Determine the boundaries of the process Determine the various steps in the process through team brainstorming or walking the process Build the sequence of the process, putting everything in the appropriate order Draw the flowchart using the appropriate mapping symbols Question 12 1 pts helps members of a team quickly familiarize themselves with the process at an organizational level and visually understand the scope of the project Stakeholder map Value stream map Force field analysis SIPOC (supplier, inputs, process, output, customer) chart 1 pts 55, which stands for sort (seiri), straighten (seiton), shine (seiso), standardize (seiketsu), and sustain (shitsuke), is used to: Distinguish between special and common causes of variation Create order and organization Validate compliance with ISO-9001 Track process outcomes and identify out-of-control situations Question 15 1 pts Mistake proofing (poka-yoke) is achieved by: Adherence to process control charts Training and reinforcement of proper work instructions Limiting or restricting ways to complete a task to ensure accuracy and compliance Constant supervision and rapid intervention Question 16 1 pts Specification limits used in control charts should reflect the: Voice of the customer Voice of the control plan Voice of the process Voice of the enterprise Question 19 1 pts When quality is measured in counts, fractions, or percentages of defective items, that appropriate control chart to select is the: Variables control chart Attributes control chart Median control chart Individual and moving range control chart Question 19 1 pts When quality is measured in counts, fractions, or percentages of defective items, that appropriate control chart to select is the: Variables control chart Attributes control chart Median control chart Individual and moving range control chart Question 20 1 pts Which of the following events is not a source of special cause variation? Change in raw materials Broken machine Change in ambient humidity Dull tools Question 17 1 pts The process variation that is illustrated in control charts reflects the: Voice of the customer Voice of the control plan Voice of the enterprise Voice of the process Question 18 1 pts The relationship between data type and control charts can be described as which of the following? Control charts for attributes data require measurement both on a discrete and continuous scale Control charts for variables data require measurement on a continuous scale Control charts for attributes data require measurement on a continuous scale Control charts for variables data require measurement on a discrete scale

Step by Step Solution

There are 3 Steps involved in it

1 Expert Approved Answer
Step: 1 Unlock blur-text-image
Question Has Been Solved by an Expert!

Get step-by-step solutions from verified subject matter experts

Step: 2 Unlock
Step: 3 Unlock

Students Have Also Explored These Related General Management Questions!