

Question: Question 11 A sample containing copper (MW 63.55g/mol ) was analyzed using atomic absorption spectroscopy by standard additions method. Samples of copper were prepared using
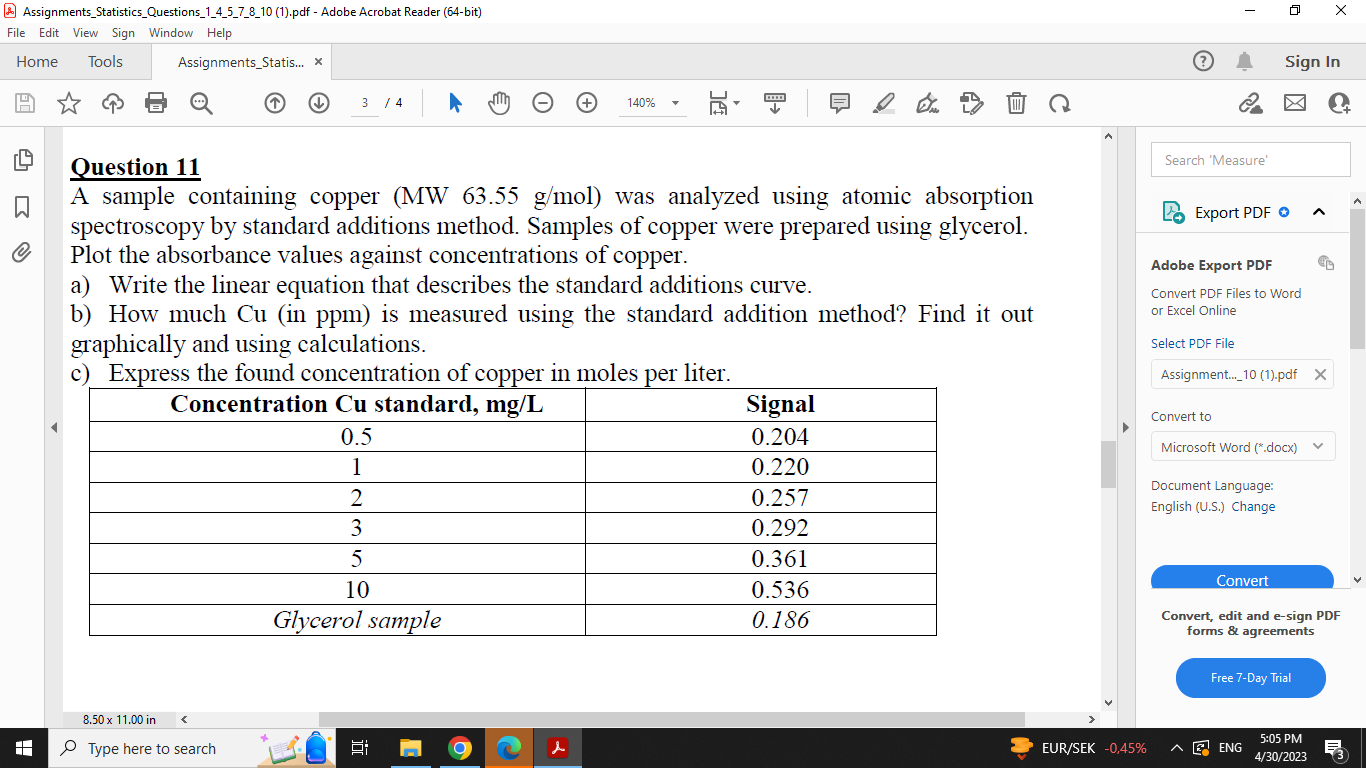
Question 11 A sample containing copper (MW 63.55g/mol ) was analyzed using atomic absorption spectroscopy by standard additions method. Samples of copper were prepared using glycerol. Plot the absorbance values against concentrations of copper. a) Write the linear equation that describes the standard additions curve. b) How much Cu (in ppm) is measured using the standard addition method? Find it out graphically and using calculations. c) Express the found concentration of copper in moles per liter. Question 11 A sample containing copper (MW 63.55g/mol ) was analyzed using atomic absorption spectroscopy by standard additions method. Samples of copper were prepared using glycerol. Plot the absorbance values against concentrations of copper. a) Write the linear equation that describes the standard additions curve. b) How much Cu (in ppm) is measured using the standard addition method? Find it out graphically and using calculations. c) Express the found concentration of copper in moles per liter
Step by Step Solution
There are 3 Steps involved in it

Get step-by-step solutions from verified subject matter experts