

Question: question 12 please 12. Copy the formula in cell 115 and then paste only the formula in the range 116:123. 13. Change the chart in
question 12 please 
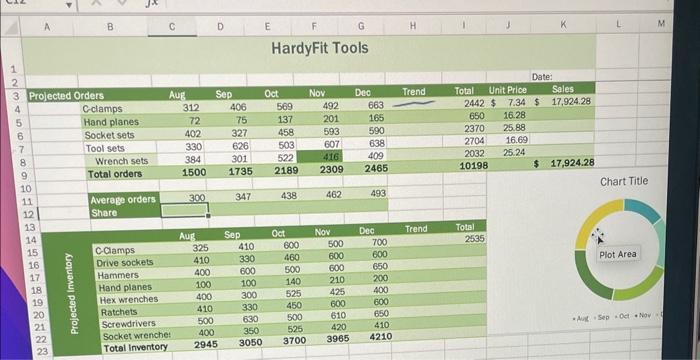
12. Copy the formula in cell 115 and then paste only the formula in the range 116:123. 13. Change the chart in the range 310:O23 to a Pie chart. Enter Average Orders per Month as the chart title. Add data labels to the outside end of each slice. Your workbook should look like the Final Figures on the following pages. Save your changes, close the workbook, and then exit Excel. Follow the directions on the SAM website to submit your
Step by Step Solution
There are 3 Steps involved in it
1 Expert Approved Answer
Step: 1 Unlock

Question Has Been Solved by an Expert!
Get step-by-step solutions from verified subject matter experts
Step: 2 Unlock
Step: 3 Unlock