

Question: question 1,2,3,4 12 13 11 10 AVERAGE 9 7 WEEK + 2 1 3 3 33 26 55 46 Atlanta Boston Chicago Datos LA Total
question 1,2,3,4
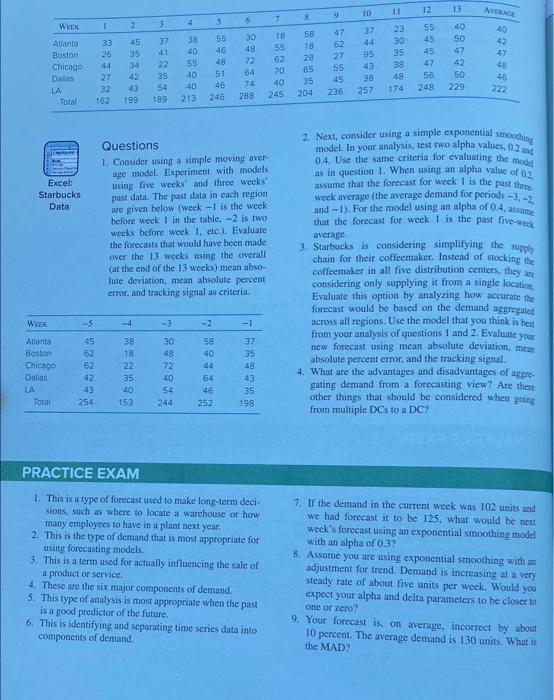
12 13 11 10 AVERAGE 9 7 WEEK + 2 1 3 3 33 26 55 46 Atlanta Boston Chicago Datos LA Total 45 35 34 42 40 42 47 37 41 22 35 54 189 38 40 55 40 40 213 30 48 72 64 74 288 58 18 28 65 18 55 02 70 40 245 62 27 55 45 236 37 44 95 43 38 257 55 45 45 47 56 248 23 30 35 38 48 174 40 50 47 42 50 229 27 32 51 46 246 46 222 204 162 199 Excel Starbucks Data Questions 1. Consider using a simple moving aver age model. Experiment with models using five weeks and three weeks' past data. The past data in each region are given below (week-1 is the week before week I in the table. -2 is two weeks before week 1. etc.). Evaluate the forecasts that would have been made over the 13 weeks using the overall (at the end of the 13 weeks) mean abso- lute deviation, mean absolute percent error, and tracking signal as criteria 2. Next, consider using a simple exponential smotang model. In your analysis, test two alpha values, 0.2 and 0.4. Use the same criteria for evaluating the model as in question I When using an alpha value of 02 assume that the forecast for week I is the past three weck average (the average demand for periods -3, -2 and-1). For the model using an alpha of 0.4. assume that the forecast for week I is the past five-week average 3. Starbucks is considering simplifying the supply chain for their coffeemaker. Instead of stocking the coffeemaker in all five distribution centers, they are considering only supplying it from a single location Evaluate this option by analyzing how accurate the forecast would be based on the demand aggregatet across all regions. Use the model that you think is ben from your analysis of questions 1 and 2. Evaluate your new forecast using mean absolute deviation, mean absolute percent error, and the tracking signal. 4. What are the advantages and disadvantages of aggre- gating demand from a forecasting view? Are there other things that should be considered when going from multiple DCs to a DC? WEEK -5 -4 -3 -2 -1 Atlanta Boston Chicago Dallas LA Total 45 62 62 42 43 254 38 18 22 35 40 153 30 48 72 40 54 244 58 40 44 64 46 252 37 35 48 43 35 198 ( PRACTICE EXAM 1. This is a type of forecast used to make long-term deci- sions, such as where to locate a warehouse or how many employees to have in a plant next year. 2. This is the type of demand that is most appropriate for using forecasting models. 3. This is a term used for actually influencing the sale of a product or service, 4. These are the six major components of demand 5. This type of analysis is most appropriate when the past is a good predictor of the future, 6. This is identifying and separating time series data into components of demand. 7. If the demand in the current week was 102 units and we had forecast it to be 125, what would be next week's forecast using an exponential smoothing model with an alpha of 0.3? 8. Assume you are using exponential smoothing with an adjustment for trend. Demand is increasing at a very steady rate of about five units per week. Would you expect your alpha and delta parameters to be closer to one or zero? 9. Your forecast is, on average, incorrect by about 10 percent. The average demand is 130 units. What is the MAD Step by Step Solution
There are 3 Steps involved in it
1 Expert Approved Answer
Step: 1 Unlock

Question Has Been Solved by an Expert!
Get step-by-step solutions from verified subject matter experts
Step: 2 Unlock
Step: 3 Unlock