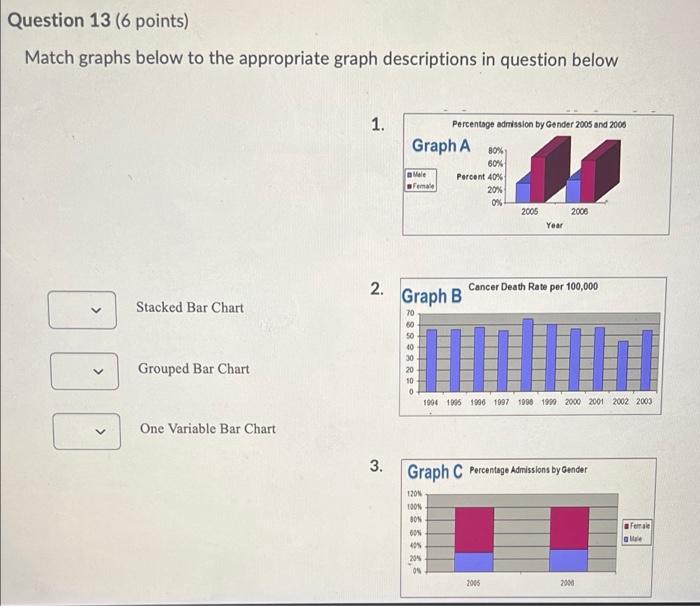
Question: Question 13 (6 points) Match graphs below to the appropriate graph descriptions in question below 1. Percentage admission by Gender 2005 and 2006 Graph A

Question 13 (6 points) Match graphs below to the
Question 13 (6 points) Match graphs below to the appropriate graph descriptions in question below 1. Percentage admission by Gender 2005 and 2006 Graph A Boy Male female 60% Percent 40% 20% 0% 2005 2008 Year 2. Cancer Death Rate per 100,000 V Stacked Bar Chart Graph B 70 60 50 40 30 20 10 0 Grouped Bar Chart H TAI 1904 1905 1906 1007 1998 1999 2000 2001 2002 2003 One Variable Bar Chart

Step by Step Solution

There are 3 Steps involved in it

1 Expert Approved Answer
Step: 1 Unlock blur-text-image
Question Has Been Solved by an Expert!

Get step-by-step solutions from verified subject matter experts

Step: 2 Unlock
Step: 3 Unlock

Students Have Also Explored These Related General Management Questions!