

Question: question 1,3 and 4 Answer 2&3 question on the basis of this data Assume that you recently graduated with an MBA degree and have just
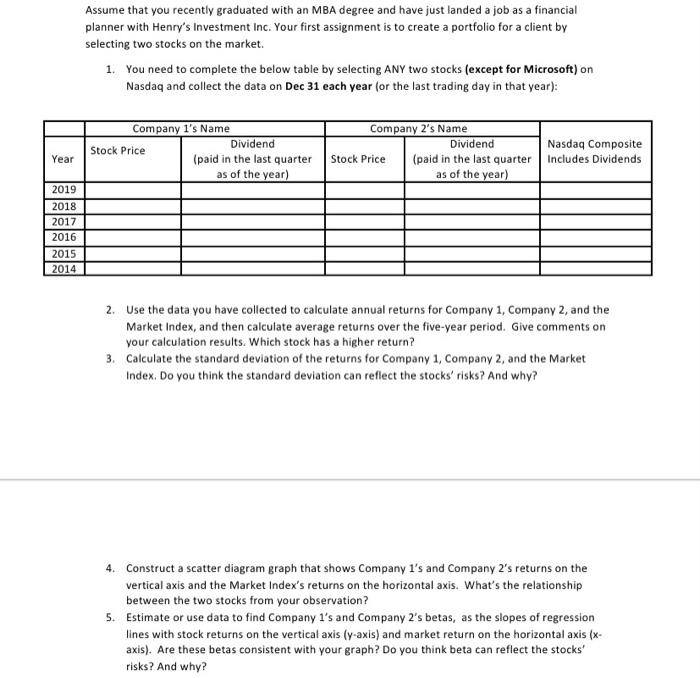
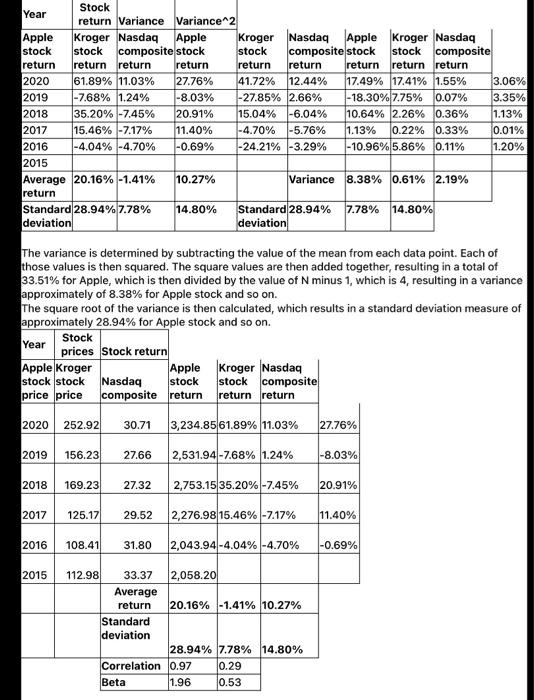
Assume that you recently graduated with an MBA degree and have just landed a job as a financial planner with Henry's Investment Inc. Your first assignment is to create a portfolio for a client by selecting two stocks on the market. 1. You need to complete the below table by selecting ANY two stocks (except for Microsoft) on Nasdaq and collect the data on Dec 31 each year for the last trading day in that year): Company 1's Name Dividend Stock Price (paid in the last quarter as of the year) Company 2's Name Dividend Stock Price (paid in the last quarter as of the year) Nasdaq Composite Includes Dividends Year 2019 2018 2017 2016 2015 2014 2. Use the data you have collected to calculate annual returns for Company 1, Company 2, and the Market Index, and then calculate average returns over the five-year period. Give comments on your calculation results. Which stock has a higher return? 3. Calculate the standard deviation of the returns for Company 1, Company 2, and the Market Index. Do you think the standard deviation can reflect the stocks' risks? And why? 4. Construct a scatter diagram graph that shows Company 1's and Company 2's returns on the vertical axis and the Market Index's returns on the horizontal axis. What's the relationship between the two stocks from your observation? 5. Estimate or use data to find Company 1's and Company 2's betas, as the slopes of regression lines with stock returns on the vertical axis (y-axis) and market return on the horizontal axis (x- axis). Are these betas consistent with your graph? Do you think beta can reflect the stocks risks? And why? Year Stock return Variance Variance2 Apple Kroger Nasdaq Apple Kroger Nasdaq Apple Kroger Nasdaq stock stock composite stock stock composite stock stock composite return return return return return return return return return 2020 61.89% 11.03% 27.76% 41.72% 12.44% 117.49% 17.41% 1.55% 3.06% 2019 -7.68% 1.24% -8.03% -27.85% 2.66% -18.30% 7.75% 0.07% 3.35% 2018 35.20% -7.45% 20.91% 15.04% -6.04% 10.64% 2.26% 0.36% 1.13% 2017 15.46% -7.17% 11.40% -4.70% -5.76% 1.13% 0.22% 0.33% 0.01% 2016 -4.04% -4.70% -0.69% -24.21% -3.29% -10.96%5.86% 10.11% 1.20% 2015 Average 20.16% -1.41% 10.27% Variance 8.38% 0.61% 2.19% return Standard 28.94% 7.78% 14.80% Standard 28.94% 7.78% 14.80% deviation deviation The variance is determined by subtracting the value of the mean from each data point. Each of those values is then squared. The square values are then added together, resulting in a total of 33.51% for Apple, which is then divided by the value of N minus 1, which is 4, resulting in a variance approximately of 8.38% for Apple stock and so on. The square root of the variance is then calculated, which results in a standard deviation measure of approximately 28.94% for Apple stock and so on. Stock Year prices Stock return Apple Kroger Apple Kroger Nasdaq stock stock Nasdaq stock stock composite price price composite return return return 2020 252.92 30.71 3,234.8561.89% 11.03% 27.76% 2019 156.23 27.66 2,531.94 -7.68% 1.24% -8.03% 2018 169.23 27.32 2,753.15 35.20% -7.45% 20.91% 2017 125.17 29.52 2,276.98 15.46% -7.17% 11.40% 2016 108.41 31.80 2,043.94 -4.04% -4.70% -0.69% 2015 112.98 33.37 2,058.20 Average return 20.16% -1.41% 10.27% Standard deviation 28.94% 7.78% 14.80% Correlation 0.97 0.29 Beta 1.96 0.53
Step by Step Solution
There are 3 Steps involved in it

Get step-by-step solutions from verified subject matter experts