

Question: QUESTION 13-7 (SIMULATION) The chl3question07 simulation Excel file on the website reproduces Figure 13-14 of the book on determining the range of firms which exits
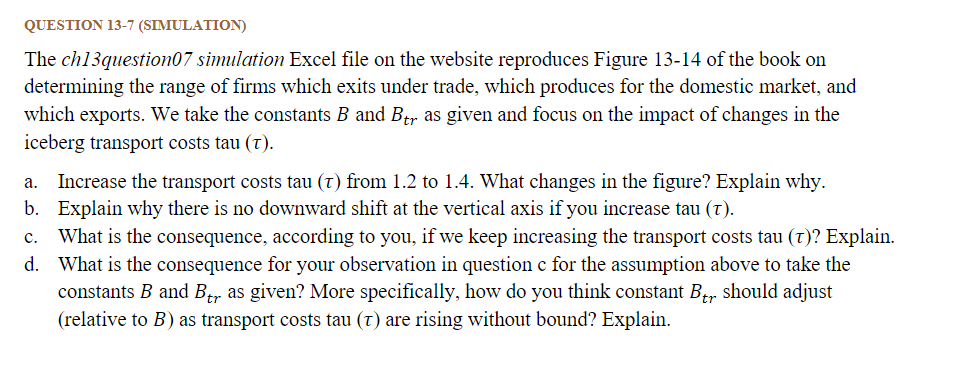
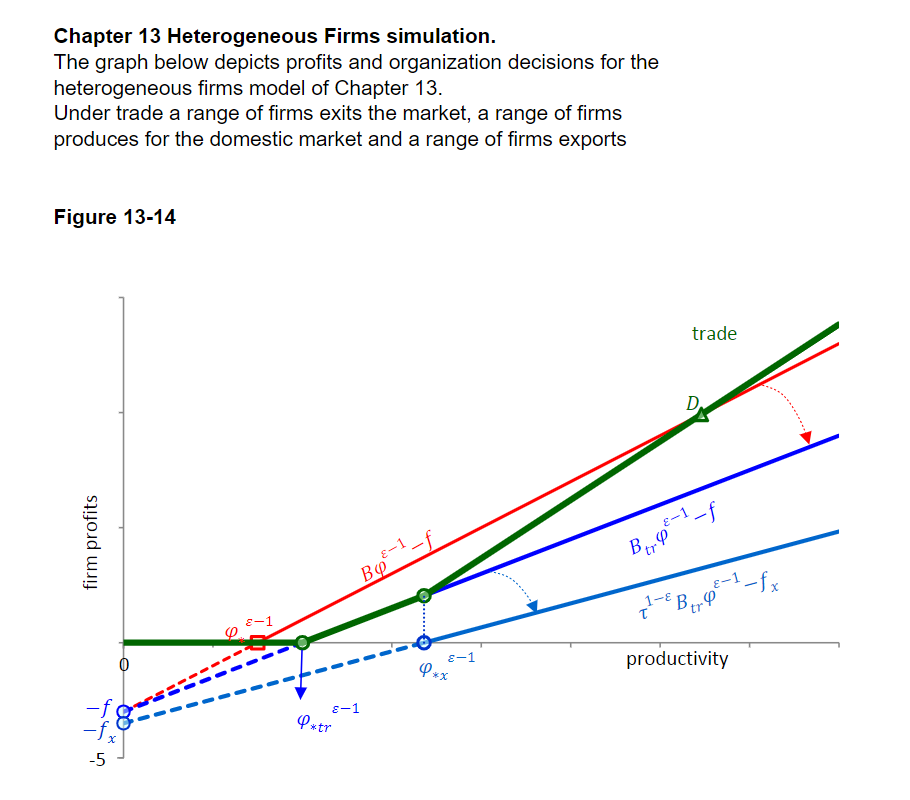
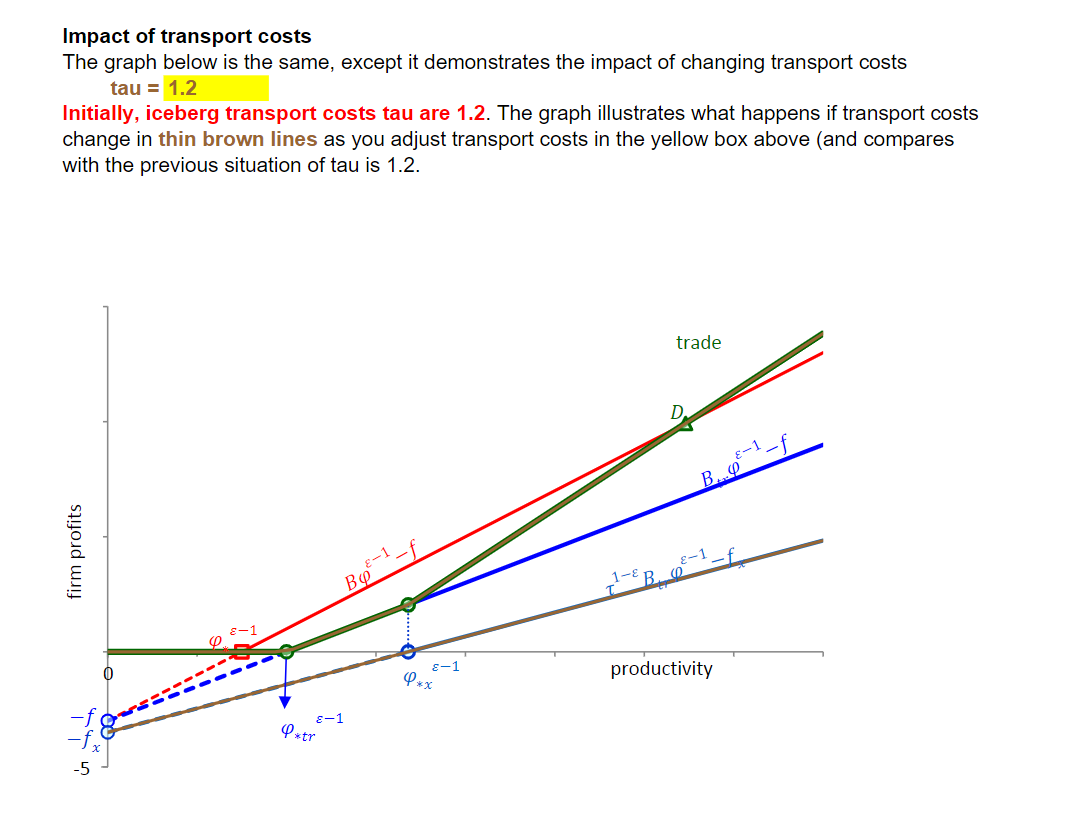
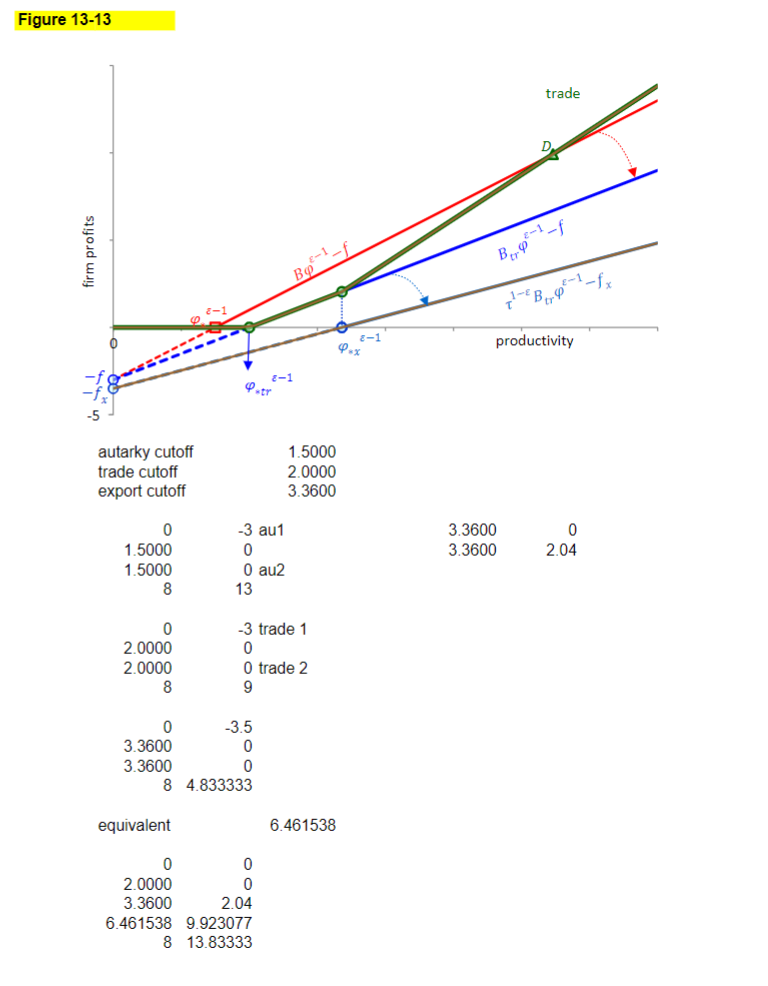
QUESTION 13-7 (SIMULATION) The chl3question07 simulation Excel file on the website reproduces Figure 13-14 of the book on determining the range of firms which exits under trade, which produces for the domestic market, and which exports. We take the constants B and Ber as given and focus on the impact of changes in the iceberg transport costs tau (T). a. Increase the transport costs tau (t) from 1.2 to 1.4. What changes in the figure? Explain why. b. Explain why there is no downward shift at the vertical axis if you increase tau (T). c. What is the consequence, according to you, if we keep increasing the transport costs tau (t)? Explain. d. What is the consequence for your observation in question c for the assumption above to take the constants B and Ber as given? More specifically, how do you think constant B., should adjust (relative to B) as transport costs tau (t) are rising without bound? Explain.Chapter 13 Heterogeneous Firms simulation. The graph below depicts profits and organization decisions for the heterogeneous firms model of Chapter 13. Under trade a range of firms exits the market, a range of firms produces for the domestic market and a range of firms exports Figure 13-14 trade firm profits B,- -f Bo -f 8-1 D E-1 productivity 8-1 f*trImpact of transport costs The graph below is the same, except it demonstrates the impact of changing transport costs tau = 1.2 Initially, iceberg transport costs tau are 1.2. The graph illustrates what happens if transport costs change in thin brown lines as you adjust transport costs in the yellow box above (and compares with the previous situation of tau is 1.2. firm profits r 'I proouctivity profit is B*phi^(epsilon - 1) - f epsilon 3 fx 3.5 B Btrade 1.5 tau 1.2 1.2 phi^(eps-1) profit dom prof exp prof tot prof exp prof 2 tot prof 2 0.00 -3.00 0.0 -3.00 -3.50 0.00 -3.50 0.20 0.00 -2.60 0.0 -2.70 -3.29 0.00 -3.29 0.00 0.40 -2.20 0.0 -2.40 -3.08 0.00 -3.08 0.60 0.00 -1.80 0.0 -2.10 -2.88 0.00 -2.88 0.00 0.80 -1.40 0.0 -1.80 -2.67 0.00 -2.67 0.00 1.00 -1.00 0.0 -1.50 -2.46 0.00 -2.46 0.00 1.20 -0.60 0.0 -1.20 -2.25 0.00 -2.25 0.00 1.40 -0.20 0.0 -0.90 -2.04 0.00 -2.04 0.00 1.60 0.20 0.2 -0.60 -1.83 0.00 -1.83 0.00 1.67 0.34 0.3 -0.50 -1.76 0.00 -1.76 0.00 1.87 0.74 0.7 -0.20 -1.55 0.00 -1.55 0.00 2.07 1.14 1.1 0.11 -1.34 0.11 -1.34 0.11 2.27 1.54 1.5 0.41 -1.14 0.41 -1.14 0.41 2.47 1.94 1.9 0.71 -0.93 0.71 -0.93 2.67 0.71 2.34 2.3 1.01 -0.72 1.01 -0.72 1.01 2.87 2.74 2.7 1.31 -0.51 1.31 -0.51 3.07 1.31 3.14 3.1 1.61 -0.30 1.61 -0.30 1.61 3.27 3.54 3.5 1.91 -0.09 1.91 -0.09 1.91 3.37 3.74 3.7 2.06 0.01 2.07 3.57 0.01 4.14 2.07 4.1 2.36 0.22 2.57 0.22 2.57 3.77 4.54 4.5 2.66 0.43 3.08 0.43 3.08 3.97 4.94 4.9 2.96 0.64 3.59 0.64 3.59 4.17 5.34 5.3 3.26 0.84 4.10 0.84 4.10 4.37 5.74 5.7 3.56 1.05 4.61 1.05 4.61 4.57 6.14 6.1 3.86 1.26 5.12 1.26 4.77 5.12 6.54 6.5 4.16 1.47 5.62 1.47 5.62 4.97 6.94 6.9 4.46 1.68 6.13 1.68 5.17 6.13 7.34 7.3 4.76 1.89 6.64 1.89 6.64 5.37 7.74 7.7 5.06 2.09 7.15 2.09 5.57 7.15 8.14 8.1 5.36 2.30 7.66 2.30 7.66 5.77 8.54 8.5 5.66 2.51 8.17 2.51 8.17 5.97 8.94 8.9 5.96 2.72 8.67 6.17 2.72 8.67 9.34 9.3 6.26 2.93 9.18 2.93 9.18 6.37 9.74 9.7 6.56 3.14 9.69 3.14 9.69 6.57 10.14 10.1 6.86 3.34 10.20 3.34 6.77 10.20 10.54 10.5 7.16 3.55 10.71 3.55 10.71 6.97 10.94 10.9 7.46 3.76 11.22 3.76 7.17 11.34 11.22 11.3 7.76 3.97 11.72 3.97 11.72 7.37 11.74 11.7 8.06 4.18 12.23 4.18 12.23 7.57 12.14 12.1 8.36 4.39 12.74 4.39 12.74 7.77 12.54 12.5 8.66 4.59 13.25 4.59 13.25 7.97 12.94 12.9 8.96 4.80 13.76 4.80 8.17 13.76 13.34 13.3 9.26 5.01 14.27 5.01 14.27\f
Step by Step Solution
There are 3 Steps involved in it

Get step-by-step solutions from verified subject matter experts