

Question: Question 14 (4 points) A simple transportation network is shown in the figure below. Factories 1, 2 and 3 are producing certain products to supply
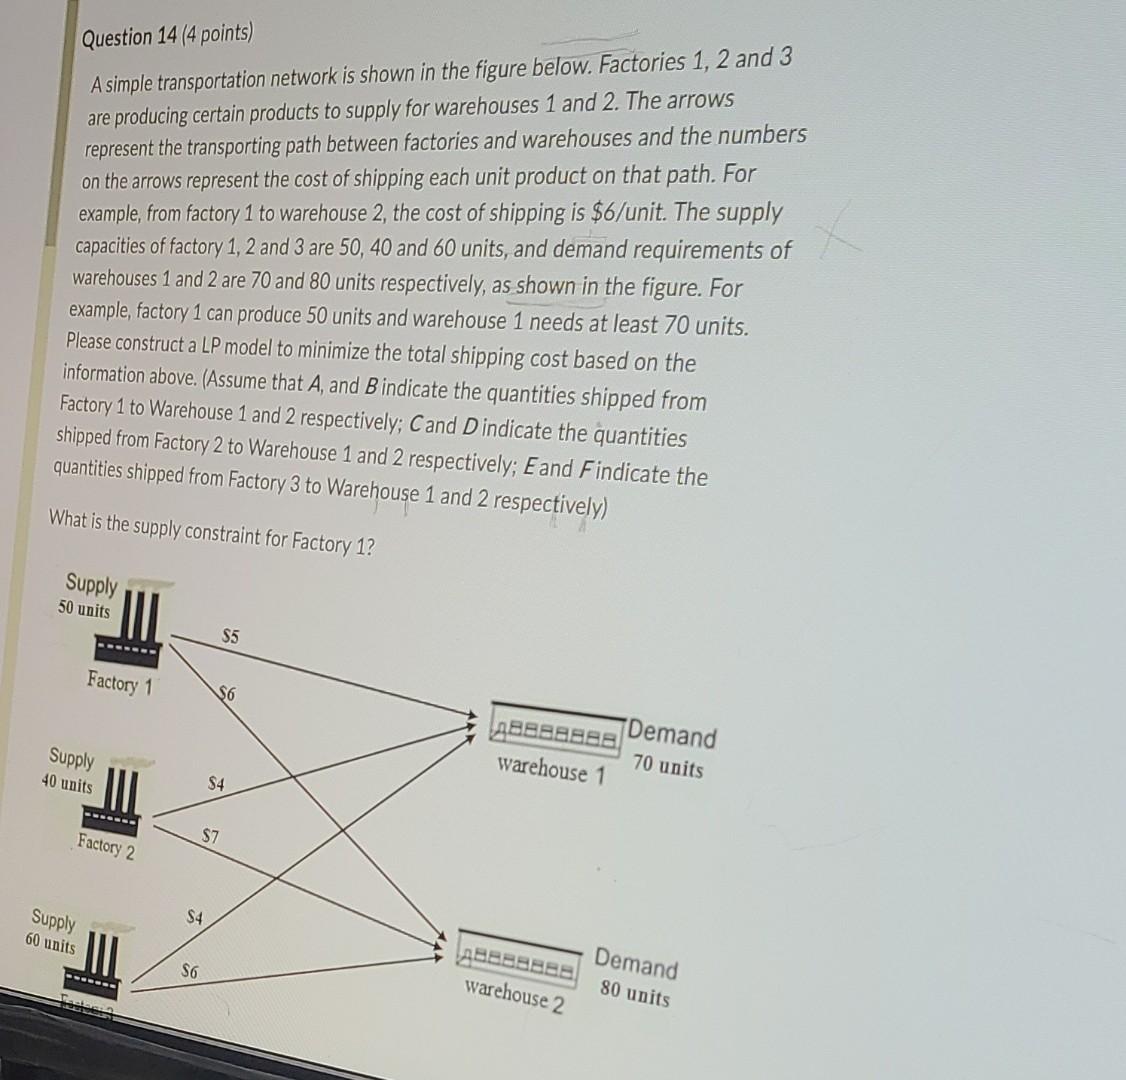
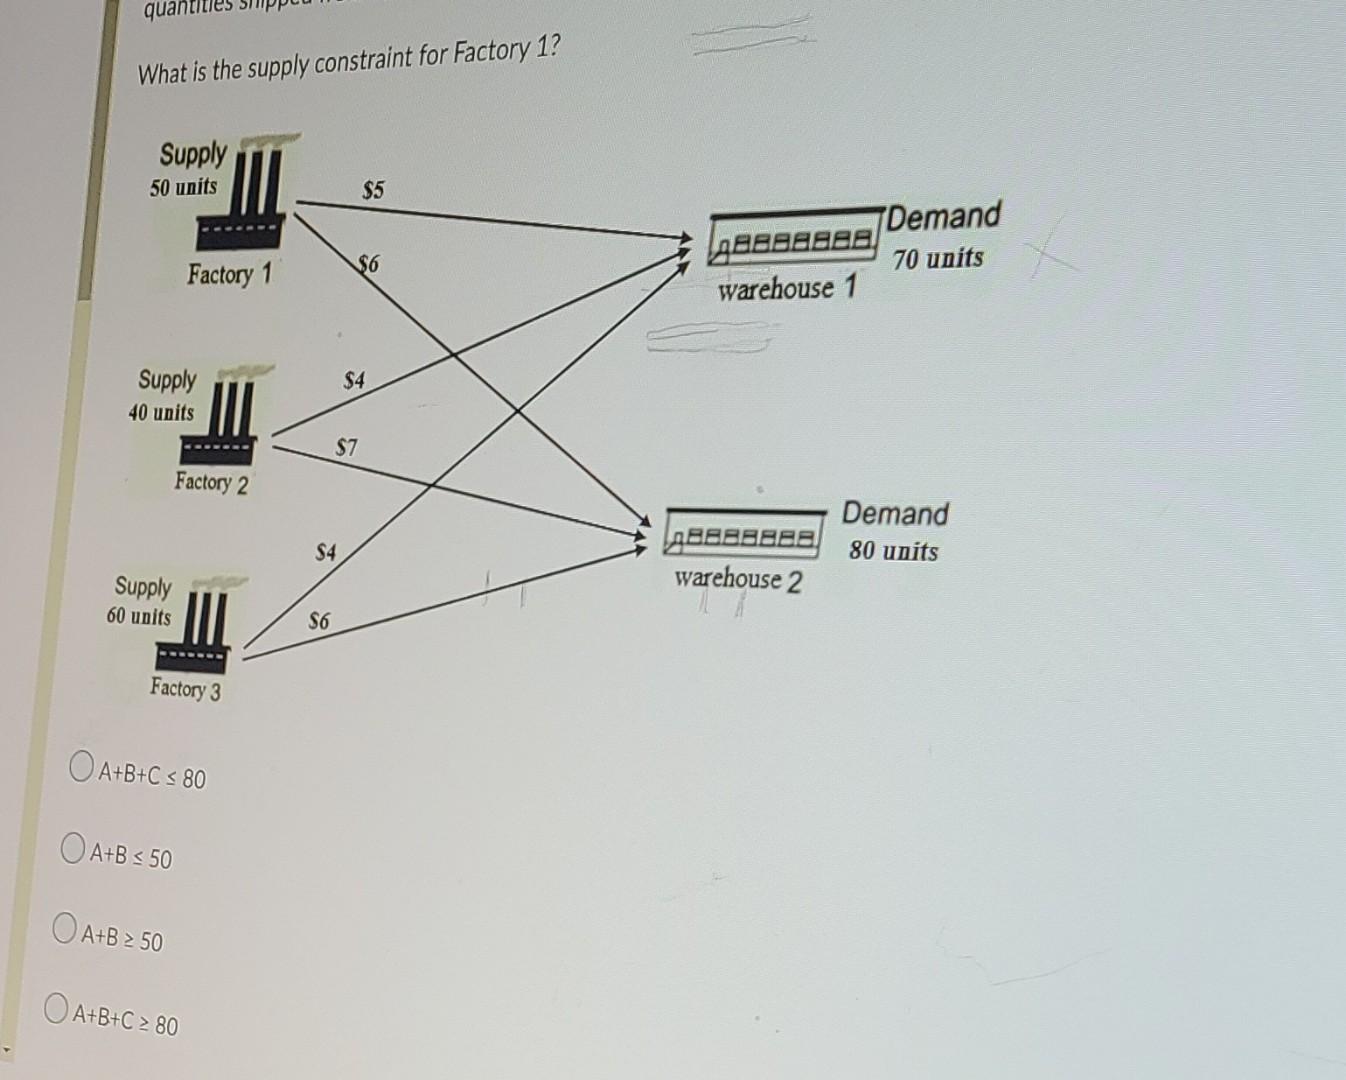
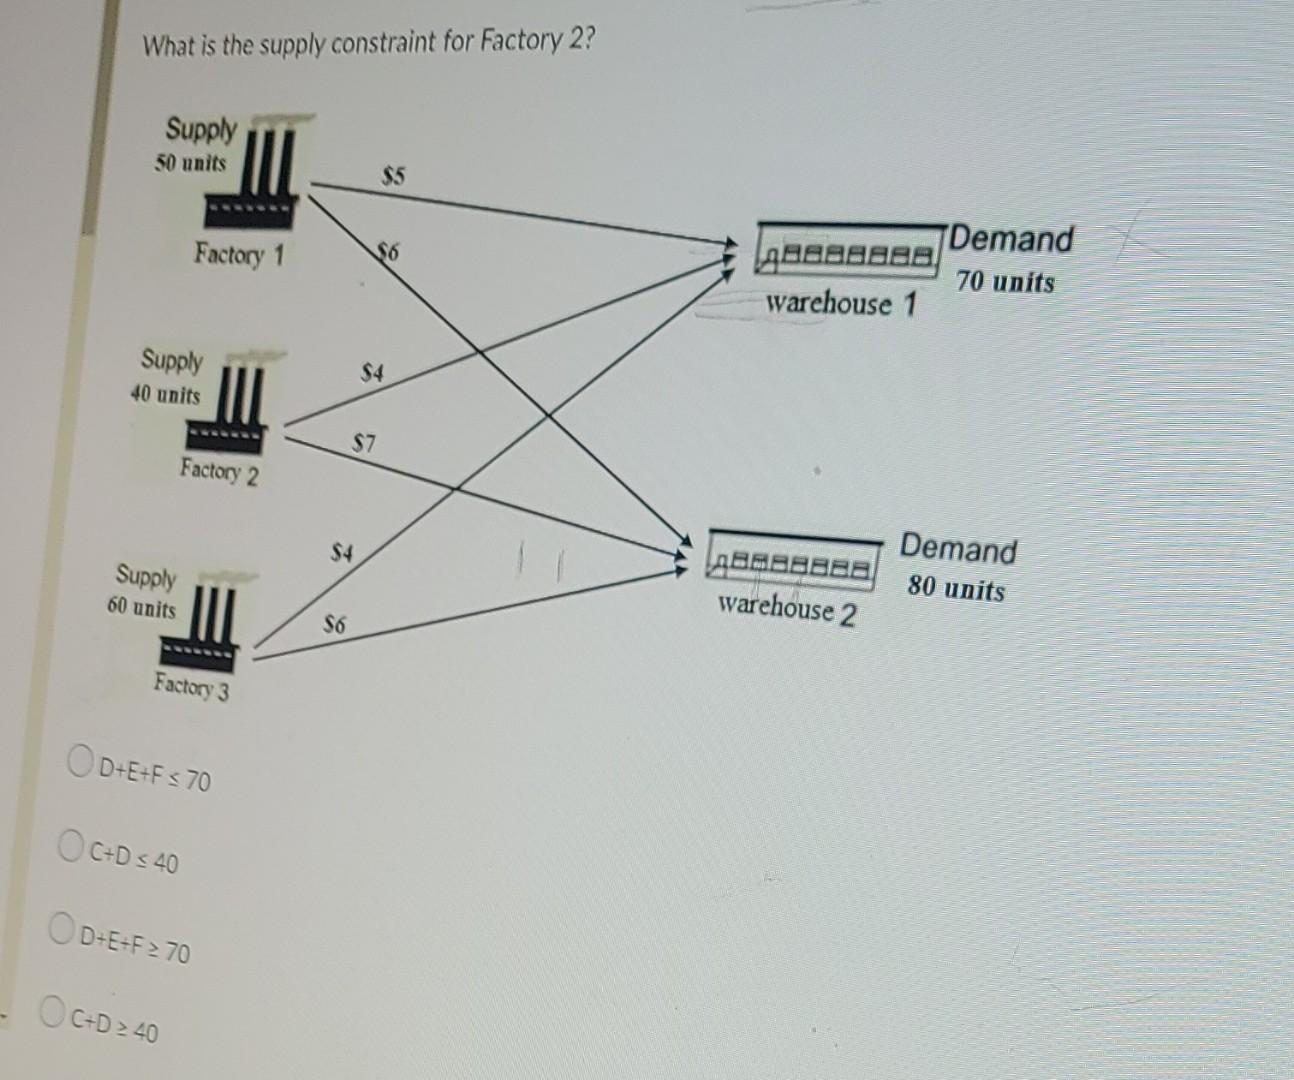
Question 14 (4 points) A simple transportation network is shown in the figure below. Factories 1, 2 and 3 are producing certain products to supply for warehouses 1 and 2. The arrows represent the transporting path between factories and warehouses and the numbers on the arrows represent the cost of shipping each unit product on that path. For example, from factory 1 to warehouse 2 , the cost of shipping is $6 /unit. The supply capacities of factory 1, 2 and 3 are 50, 40 and 60 units, and demand requirements of warehouses 1 and 2 are 70 and 80 units respectively, as shown in the figure. For example, factory 1 can produce 50 units and warehouse 1 needs at least 70 units. Please construct a LP model to minimize the total shipping cost based on the information above. (Assume that A and B indicate the quantities shipped from Factory 1 to Warehouse 1 and 2 respectively; C and D indicate the quantities shipped from Factory 2 to Warehouse 1 and 2 respectively; Eand Findicate the fuantities shipped from Factory 3 to Warehouse 1 and 2 respectively) That is the supply constraint for Factory 1 ? What is the supply constraint for Factory 1 ? A+B+C80 A+B50 A+B50 A+B+C80 What is the supply constraint for Factory 2? D+E+F70 C+D40 D+E+F70 C+D40
Step by Step Solution
There are 3 Steps involved in it
1 Expert Approved Answer
Step: 1 Unlock

Question Has Been Solved by an Expert!
Get step-by-step solutions from verified subject matter experts
Step: 2 Unlock
Step: 3 Unlock