

Question: . Question 14 The table below shows a stemplot of exam scores. The key is: 6 3 = 63 5 3 5 7 6 4


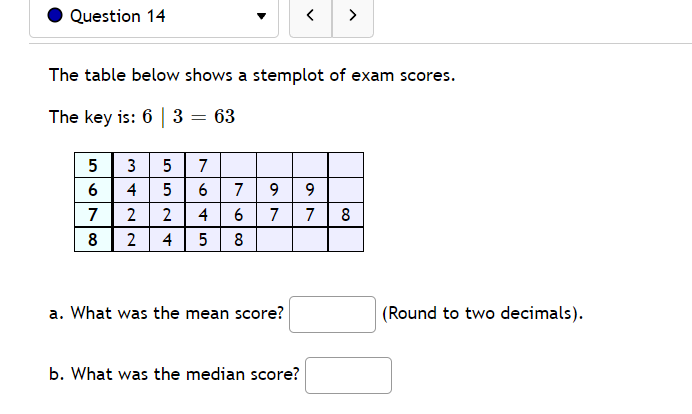
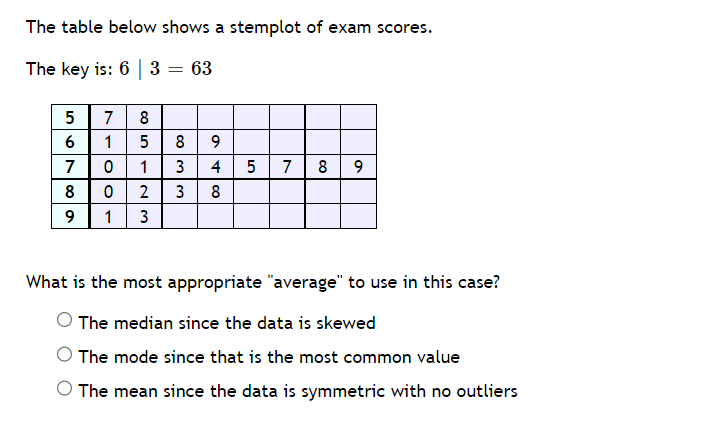
. Question 14 The table below shows a stemplot of exam scores. The key is: 6 3 = 63 5 3 5 7 6 4 5 6 7 9 9 7 2 2 4 6 7 78 8 2 4 5 8 a. What was the mean score? (Round to two decimals). b. What was the median score?The table below shows a stemplot of exam scores. The keyr is: f! I 3 = 63 What is the most appropriate "average" to use in this case? 0 The median since the data is skewed O The mode since that is the most common value 0 The mean since the data is symmetric with no outliers
Step by Step Solution
There are 3 Steps involved in it
1 Expert Approved Answer
Step: 1 Unlock

Question Has Been Solved by an Expert!
Get step-by-step solutions from verified subject matter experts
Step: 2 Unlock
Step: 3 Unlock