

Question: statistics . Question 14 The table below shows the scores of a group of students on a 10-point quiz. Test Score Frequency 3 0 4
statistics
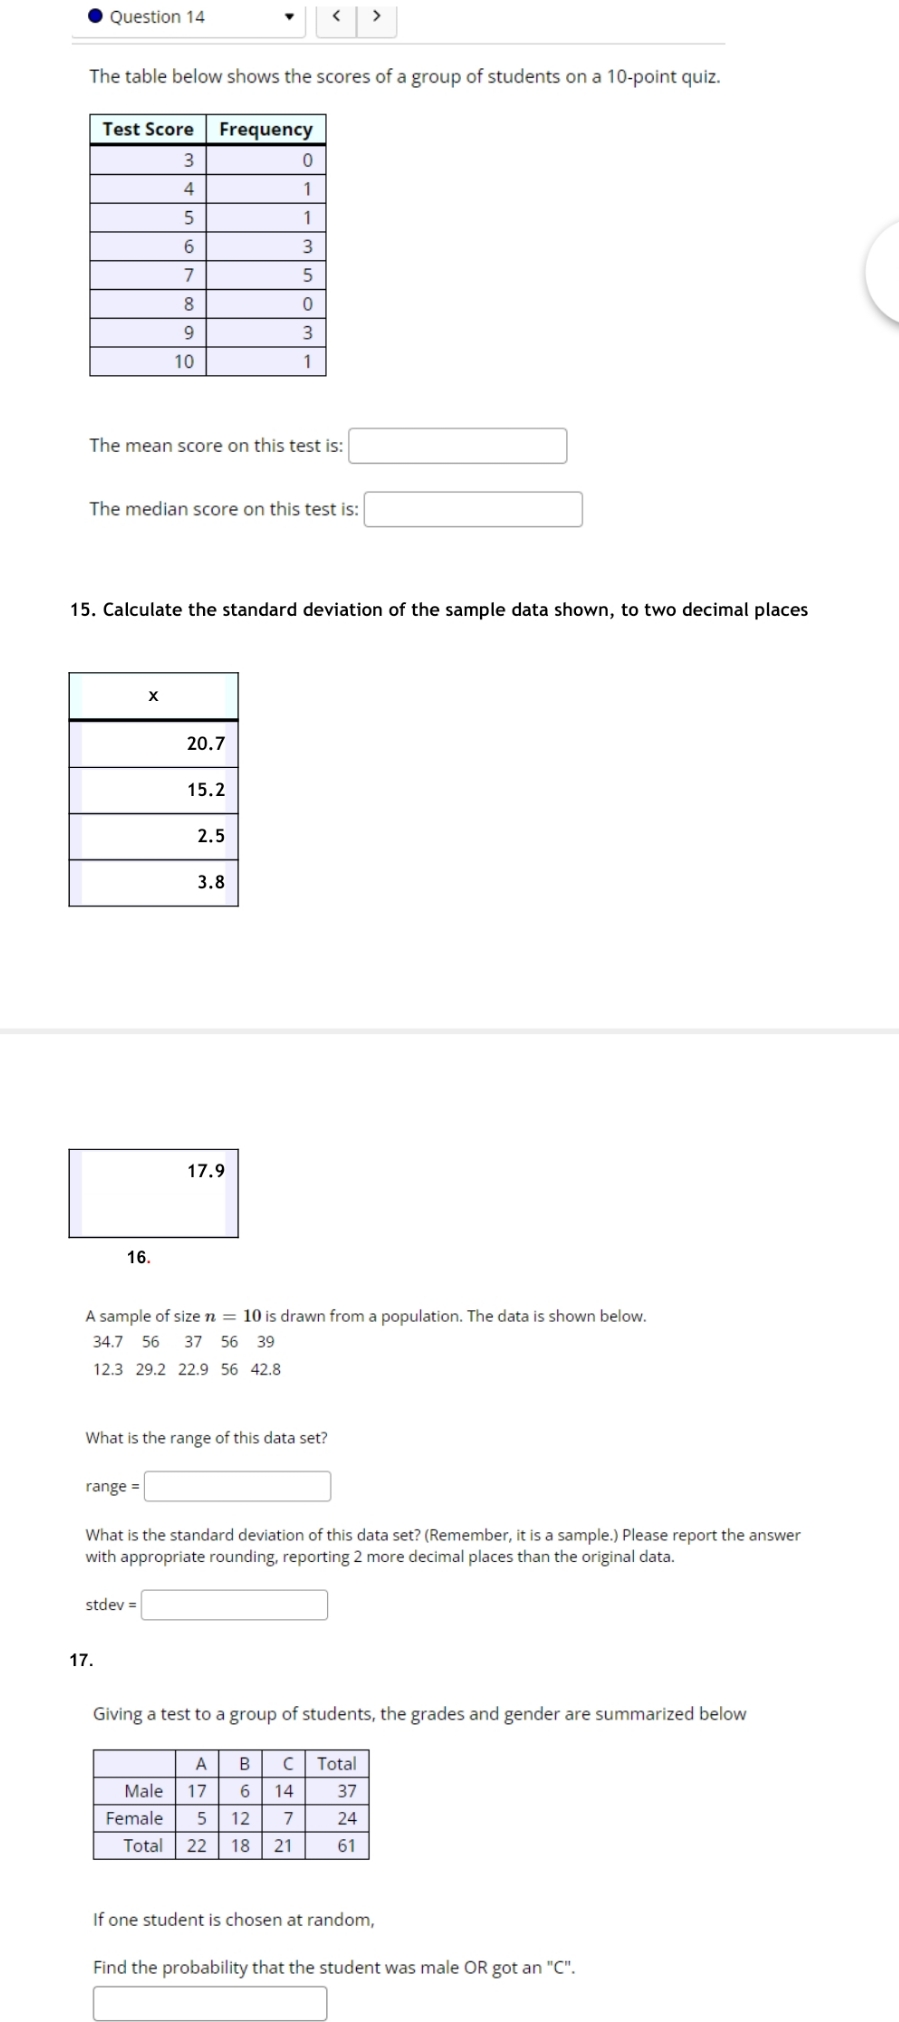
. Question 14 The table below shows the scores of a group of students on a 10-point quiz. Test Score Frequency 3 0 4 5 1 3 7 5 8 0 3 10 1 The mean score on this test is: The median score on this test is: 15. Calculate the standard deviation of the sample data shown, to two decimal places X 20.7 15.2 2.5 3.8 17.9 16. A sample of size n = 10 is drawn from a population. The data is shown below. 34.7 56 37 56 39 12.3 29.2 22.9 56 42.8 What is the range of this data set? range = What is the standard deviation of this data set? (Remember, it is a sample.) Please report the answer with appropriate rounding, reporting 2 more decimal places than the original data. stdev = 17. Giving a test to a group of students, the grades and gender are summarized below A B C Total Male 17 6 14 37 Female 5 12 7 24 Total 22 18 21 61 If one student is chosen at random, Find the probability that the student was male OR got an "C"
Step by Step Solution
There are 3 Steps involved in it

Get step-by-step solutions from verified subject matter experts