

Question: Question 15 2.5 points Save Answer Price 355 0 50 45 100 200 300 Quantity The graph above is for the market for broadband home
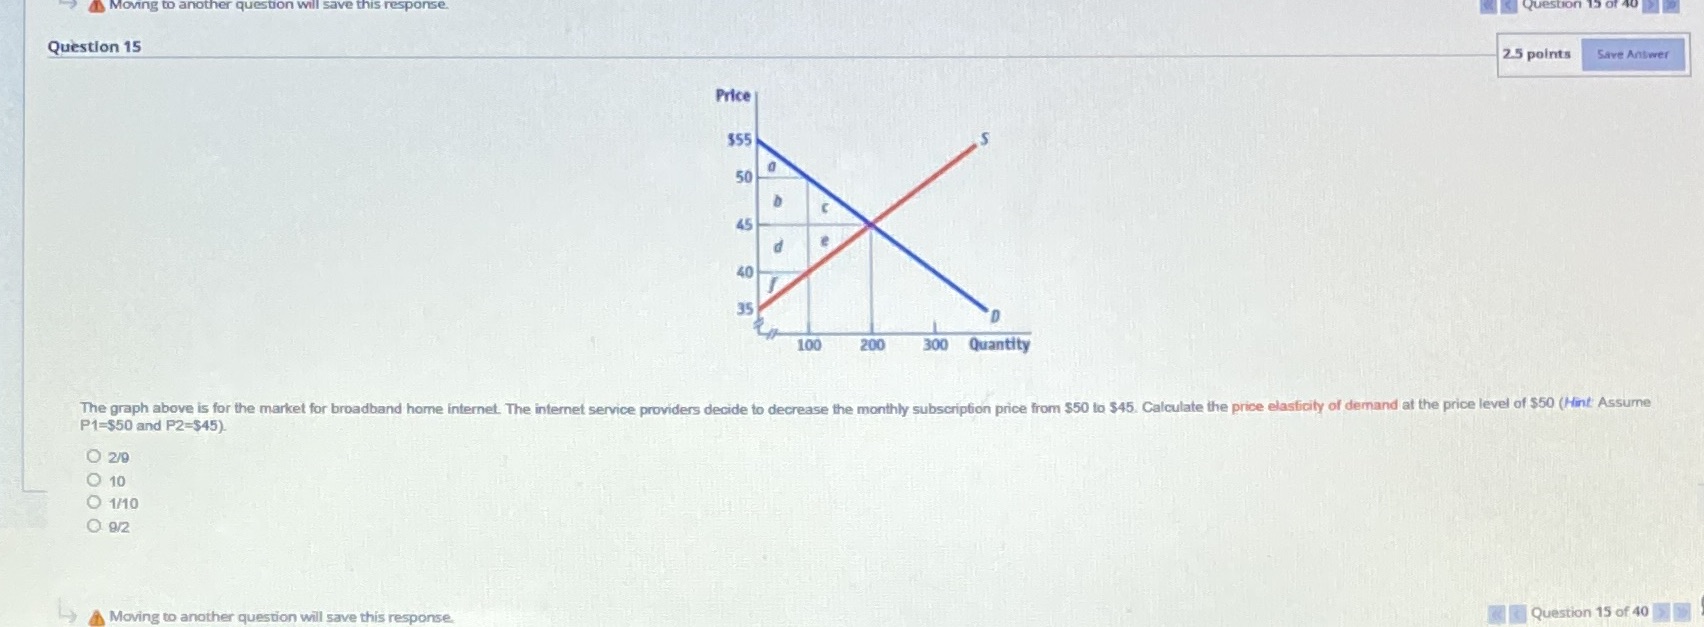
Question 15 2.5 points Save Answer Price 355 0 50 45 100 200 300 Quantity The graph above is for the market for broadband home internet. The internet service providers decide to decrease the monthly subscription price from $50 to $45. Calculate the price elasticity of demand at the price level of $50 (Hint Assume P1=$50 and P2=$45) O 2/9 O 10 O 1/10 Q 9/2 Moving to another question will save this response Question 15 of 40
Step by Step Solution
There are 3 Steps involved in it
1 Expert Approved Answer
Step: 1 Unlock

Question Has Been Solved by an Expert!
Get step-by-step solutions from verified subject matter experts
Step: 2 Unlock
Step: 3 Unlock