

Question: Question 16 $0.5$ Points The grouped frequency table below shows the frequency distribution of the age of drivers who were given a ticket. begin{tabular}{cirl hline
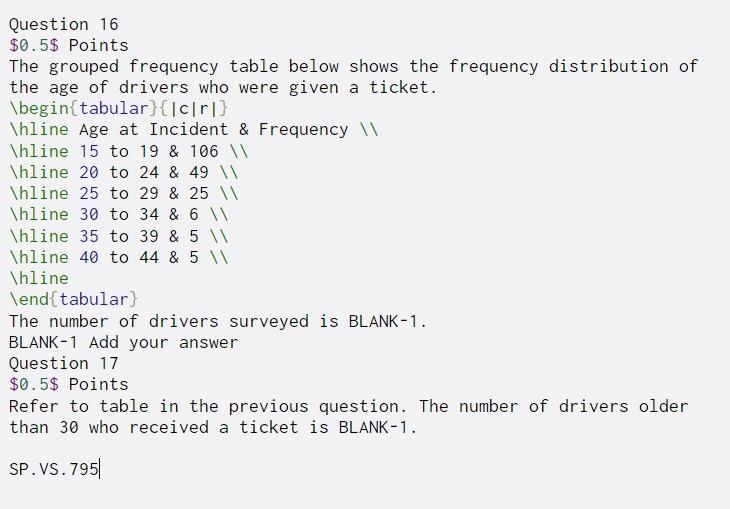
Question 16 $0.5$ Points The grouped frequency table below shows the frequency distribution of the age of drivers who were given a ticket. \begin{tabular}{cirl \hline Age at Incident & Frequency \hline 15 to 19 & 106 W \hline 20 to 24 & 49 \hline 25 to 29 & 25 \hline 30 to 34 & 6 W \hline 35 to 39 & 5 W \hline 40 to 44 & 5 W \hline \end{tabular? The number of drivers surveyed is BLANK-1. BLANK-1 Add your answer Question 17 $0.5$ Points Refer to table in the previous question. The number of drivers older than 30 who received a ticket is BLANK-1. SP.VS. 7951
Step by Step Solution
There are 3 Steps involved in it
1 Expert Approved Answer
Step: 1 Unlock

Question Has Been Solved by an Expert!
Get step-by-step solutions from verified subject matter experts
Step: 2 Unlock
Step: 3 Unlock