

Question: Question 16 4 pts a) Based on the scatter plot below, would you say that [ Select ] |linear correlation between the two variables? Would
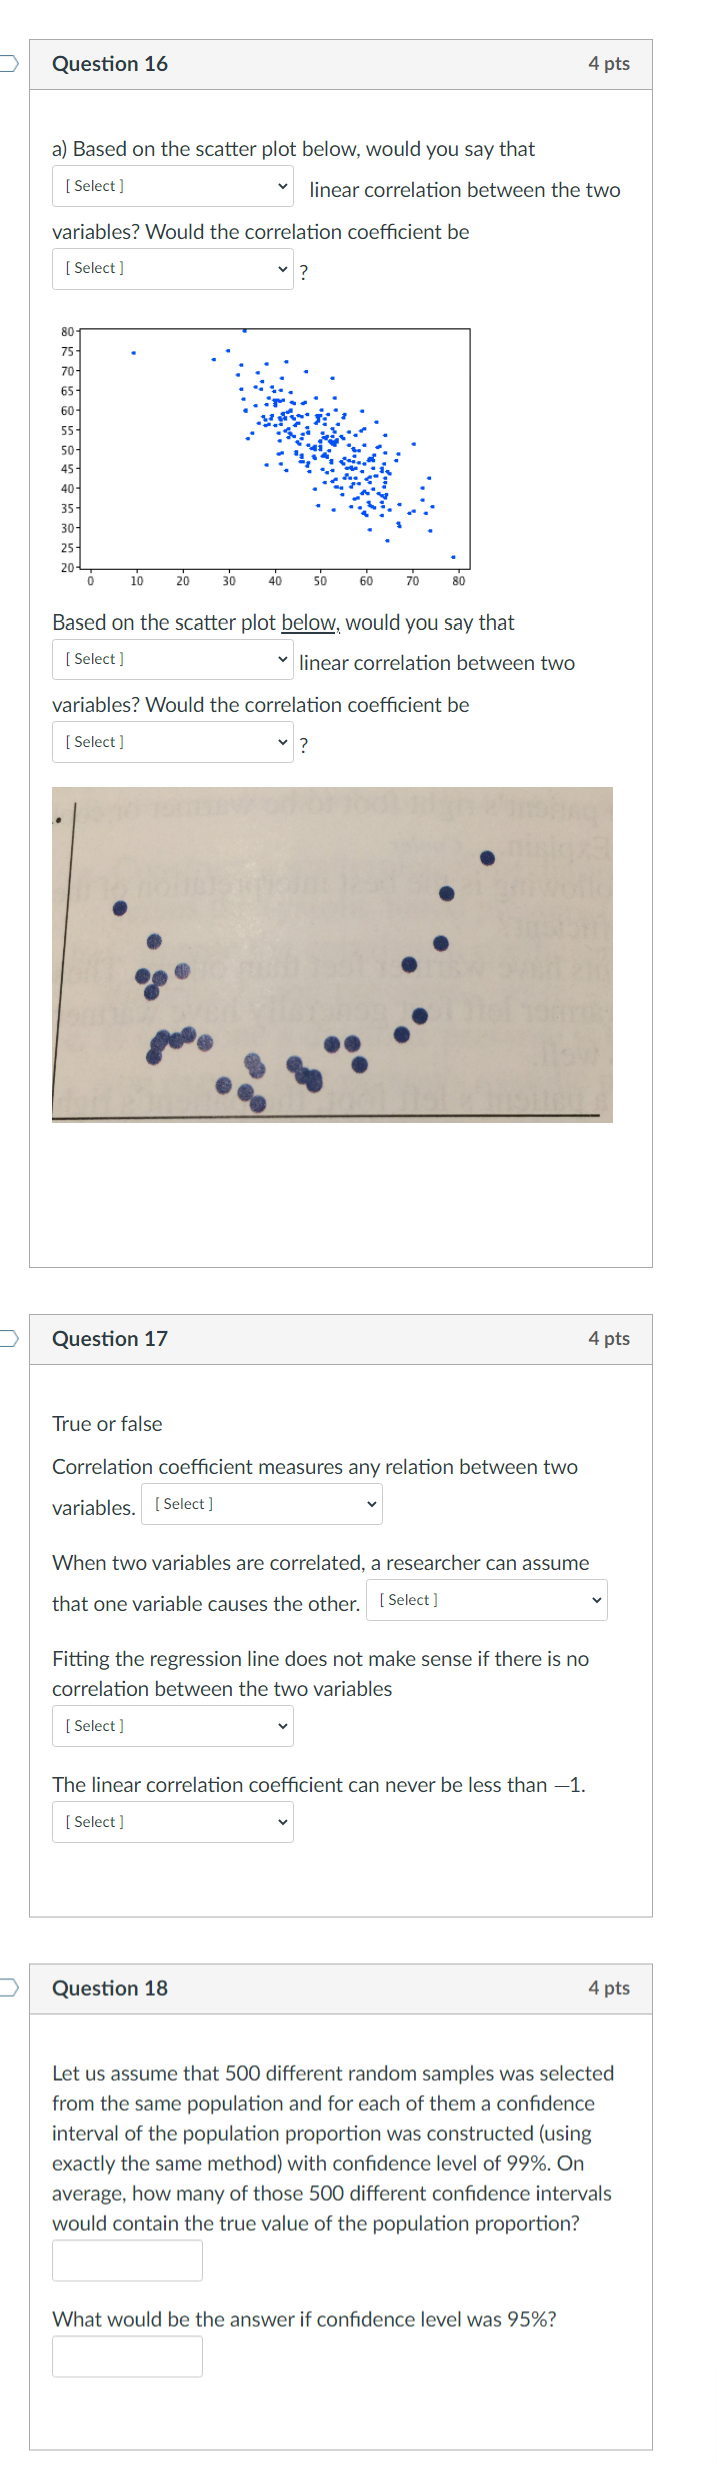
Question 16 4 pts a) Based on the scatter plot below, would you say that [ Select ] |linear correlation between the two variables? Would the correlation coefficient be [ Select ] 10 20 30 40 50 60 70 Based on the scatter plot below, would you say that [ Select ] linear correlation between two variables? Would the correlation coefficient be [ Select ] Question 17 4 pts True or false Correlation coefficient measures any relation between two variables. [ Select ] When two variables are correlated, a researcher can assume that one variable causes the other. [ Select ] Fitting the regression line does not make sense if there is no correlation between the two variables [ Select ] The linear correlation coefficient can never be less than -1. [ Select ] Question 18 4 pts Let us assume that 500 different random samples was selected from the same population and for each of them a confidence interval of the population proportion was constructed (using exactly the same method) with confidence level of 99%. On average, how many of those 500 different confidence intervals would contain the true value of the population proportion? What would be the answer if confidence level was 95%
Step by Step Solution
There are 3 Steps involved in it

Get step-by-step solutions from verified subject matter experts