

Question: Question 17 The graph shows aggregate demand, long-run aggregate supply, and the short-run aggregate supply curve, using modern Keynesian analysis. 140- Suppose that there is

Question 17
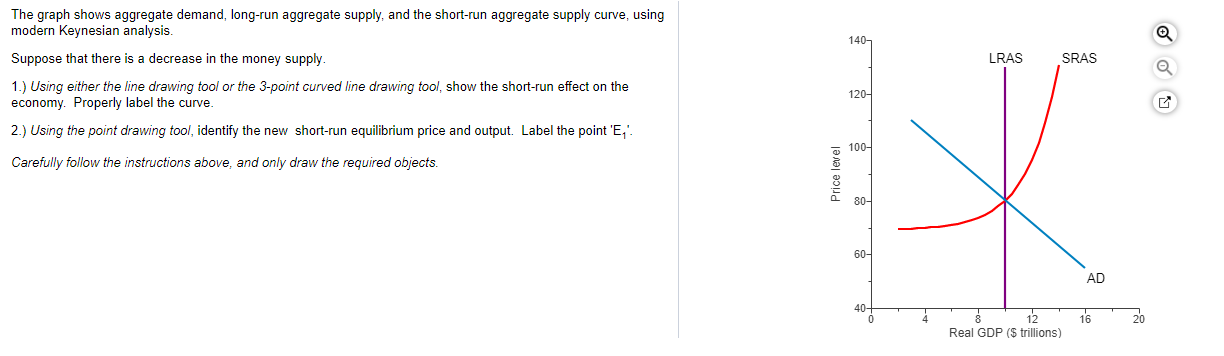
The graph shows aggregate demand, long-run aggregate supply, and the short-run aggregate supply curve, using modern Keynesian analysis. 140- Suppose that there is a decrease in the money supply. LRAS SRAS 1.) Using either the line drawing tool or the 3-point curved line drawing tool, show the short-run effect on the 120- economy. Properly label the curve. 2.) Using the point drawing tool, identify the new short-run equilibrium price and output. Label the point 'E,' 100- Carefully follow the instructions above, and only draw the required objects. Price level 80- 60- AD 40+ 8 12 16 20 Real GDP ($ trillions)
Step by Step Solution
There are 3 Steps involved in it
1 Expert Approved Answer
Step: 1 Unlock

Question Has Been Solved by an Expert!
Get step-by-step solutions from verified subject matter experts
Step: 2 Unlock
Step: 3 Unlock