

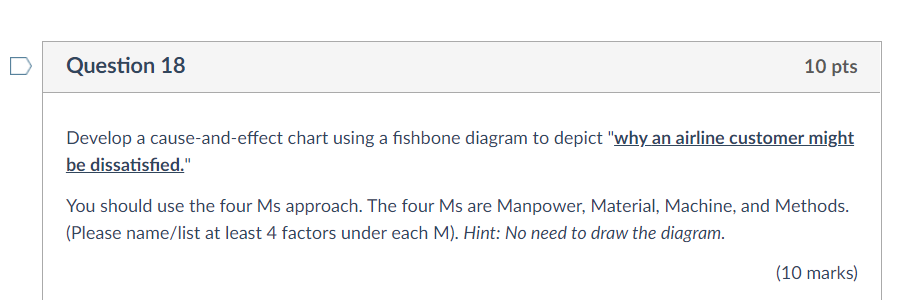
Question: Question 18 10 pts Develop a cause-and-effect chart using a fishbone diagram to depict why an airline customer might be dissatisfied. You should use the
Step by Step Solution
There are 3 Steps involved in it
1 Expert Approved Answer
Step: 1 Unlock

Question Has Been Solved by an Expert!
Get step-by-step solutions from verified subject matter experts
Step: 2 Unlock
Step: 3 Unlock