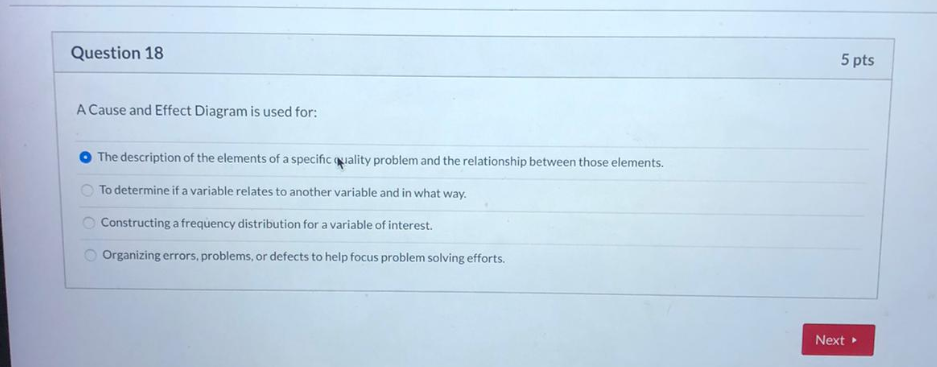
Question: Question 18 5 pts A Cause and Effect Diagram is used for: The description of the elements of a specific quality problem and the relationship

Question 18 5 pts A Cause and Effect Diagram is

Question 18 5 pts A Cause and Effect Diagram is used for: The description of the elements of a specific quality problem and the relationship between those elements. To determine if a variable relates to another variable and in what way. Constructing a frequency distribution for a variable of interest. Organizing errors, problems, or defects to help focus problem solving efforts. Next

Step by Step Solution

There are 3 Steps involved in it

1 Expert Approved Answer
Step: 1 Unlock blur-text-image
Question Has Been Solved by an Expert!

Get step-by-step solutions from verified subject matter experts

Step: 2 Unlock
Step: 3 Unlock

Students Have Also Explored These Related General Management Questions!