

Question: QUESTION 18 Forbes magazine published data on the best small firms in 2012. These were firms which had been publicly traded for at least a
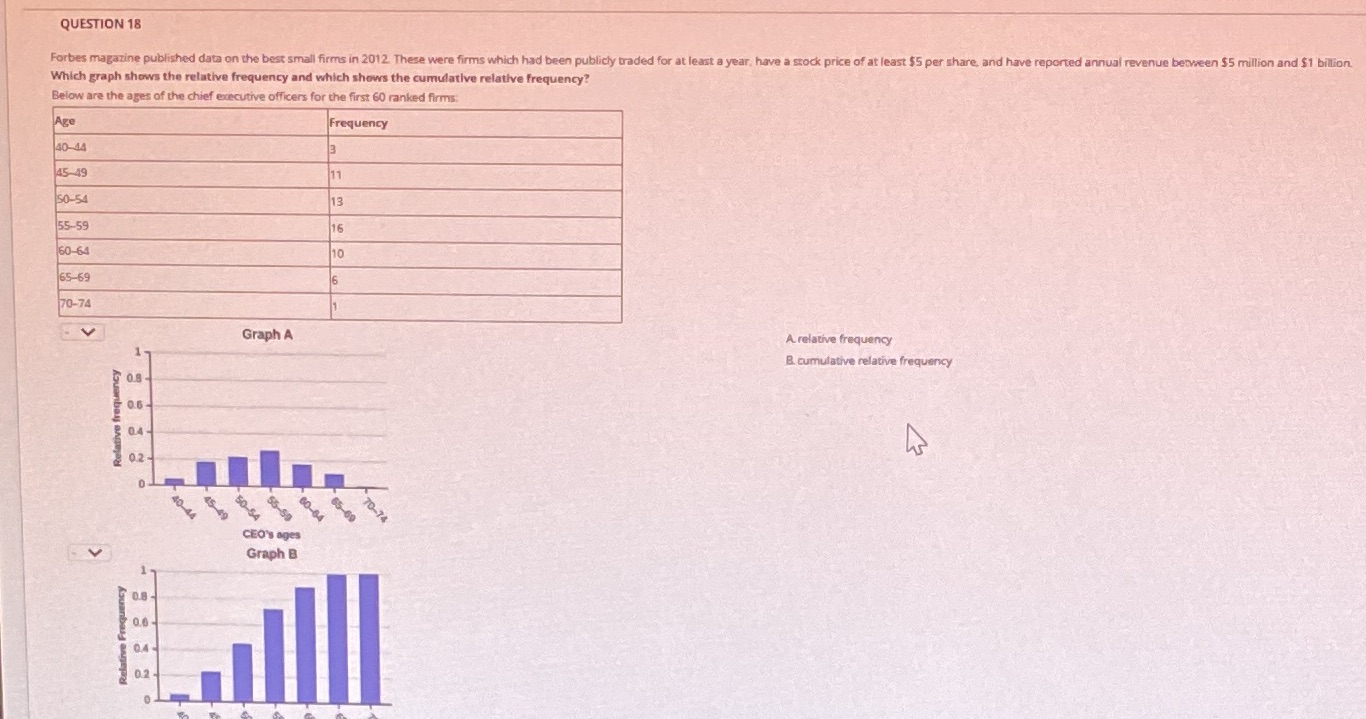
QUESTION 18 Forbes magazine published data on the best small firms in 2012. These were firms which had been publicly traded for at least a year, have a stock price of at least $5 per share, and have reported annual revenue between $5 million and $1 billion. Which graph shows the relative frequency and which shows the cumulative relative frequency? Below are the ages of the chief executive officers for the first 60 ranked firms: Age Frequency 40-44 13 45-49 11 50-54 13 55-59 16 60-64 10 65-69 70-74 Graph A A relative frequency B. cumulative relative frequency 0.8 0.6- Relative frequency 0.4 0.2 60-84 65-60 CEO's ages V Graph B 0.8 five Frequency 0.6 04
Step by Step Solution
There are 3 Steps involved in it

Get step-by-step solutions from verified subject matter experts