

Question: QUESTION 19 If the upper control limit for a c-chart is 28 and the lower control limit is 4, what is the average number
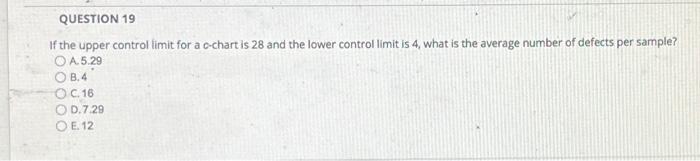
QUESTION 19 If the upper control limit for a c-chart is 28 and the lower control limit is 4, what is the average number of defects per sample? OA.5.29 OB.4 O C. 16 OD.7.29 OE. 12
Step by Step Solution
There are 3 Steps involved in it
1 Expert Approved Answer
Step: 1 Unlock

The detailed answer for the above question is provided below To find the avera... View full answer
Question Has Been Solved by an Expert!
Get step-by-step solutions from verified subject matter experts
Step: 2 Unlock
Step: 3 Unlock