

Question: Question 1A A store classifies its products by category: each product belongs to one of the categories Hardware, Garden, Home Decor. The table below lists
Question 1A
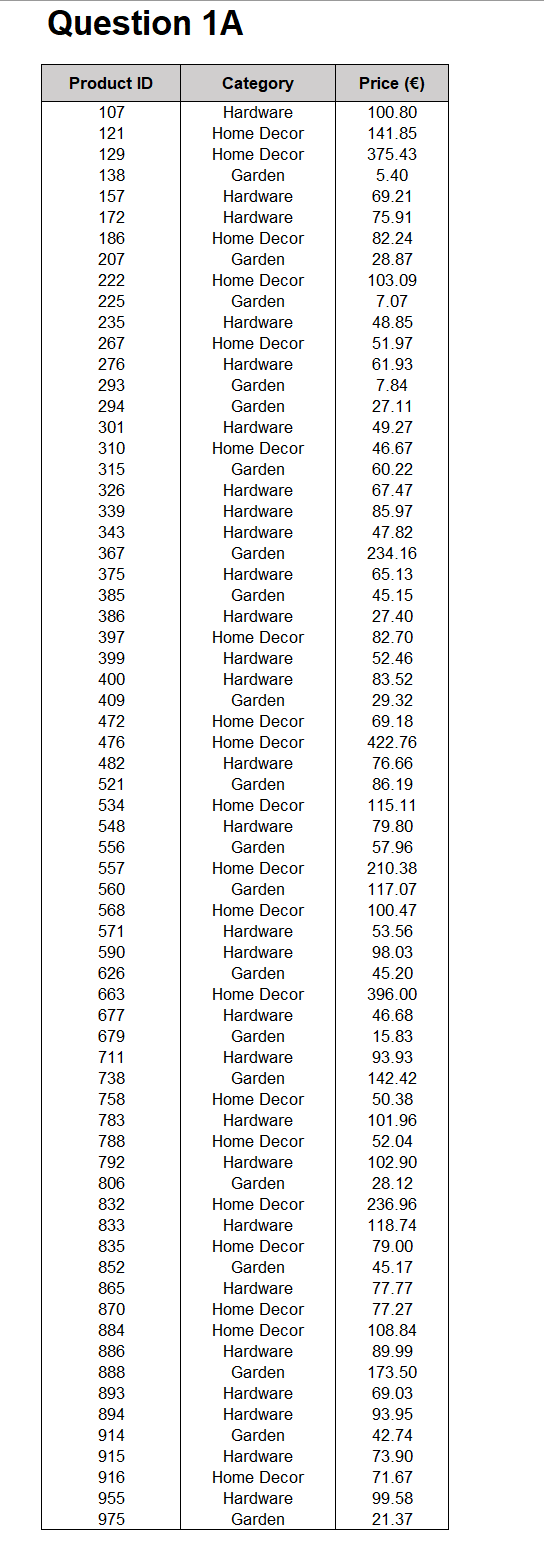
A store classifies its products by category: each product belongs to one of the categories "Hardware", "Garden", "Home Decor". The table below lists the price and category of all the store's products.
Answer the following questions: a) Classify both variables in terms of type and scale. (5%) b) Compute the relative frequency of the category "Garden". (5%) c) Obtain an adequate graphical representation of the distribution of the variable Category (5%) d) Compute the mean, median, interquartile range and standard deviation of the variable Price (10%) e) Represent the overall distribution (all products) of the variable Price with an histogram or a stem and leaf plot. (5%) f) Represent the distribution of the variable Price for each category with an histogram or stem and leaf plot. You must present three graphs, one for each category (for example, one of the graphs must show the price distribution for all products of the category "Hardware"). Based on these graphs and the graph of question e), comment and compare the four price distributions (overall, "Hardware", "Garden" and "Home Decor") (10%)
Question 1A Question 1A
Step by Step Solution
There are 3 Steps involved in it

Get step-by-step solutions from verified subject matter experts