

Question: QUESTION 2 10 points Save Answer Calculate the consumer surplus (Hint: the area of the triangle you identified in Question 1). QUESTION 3 10 points
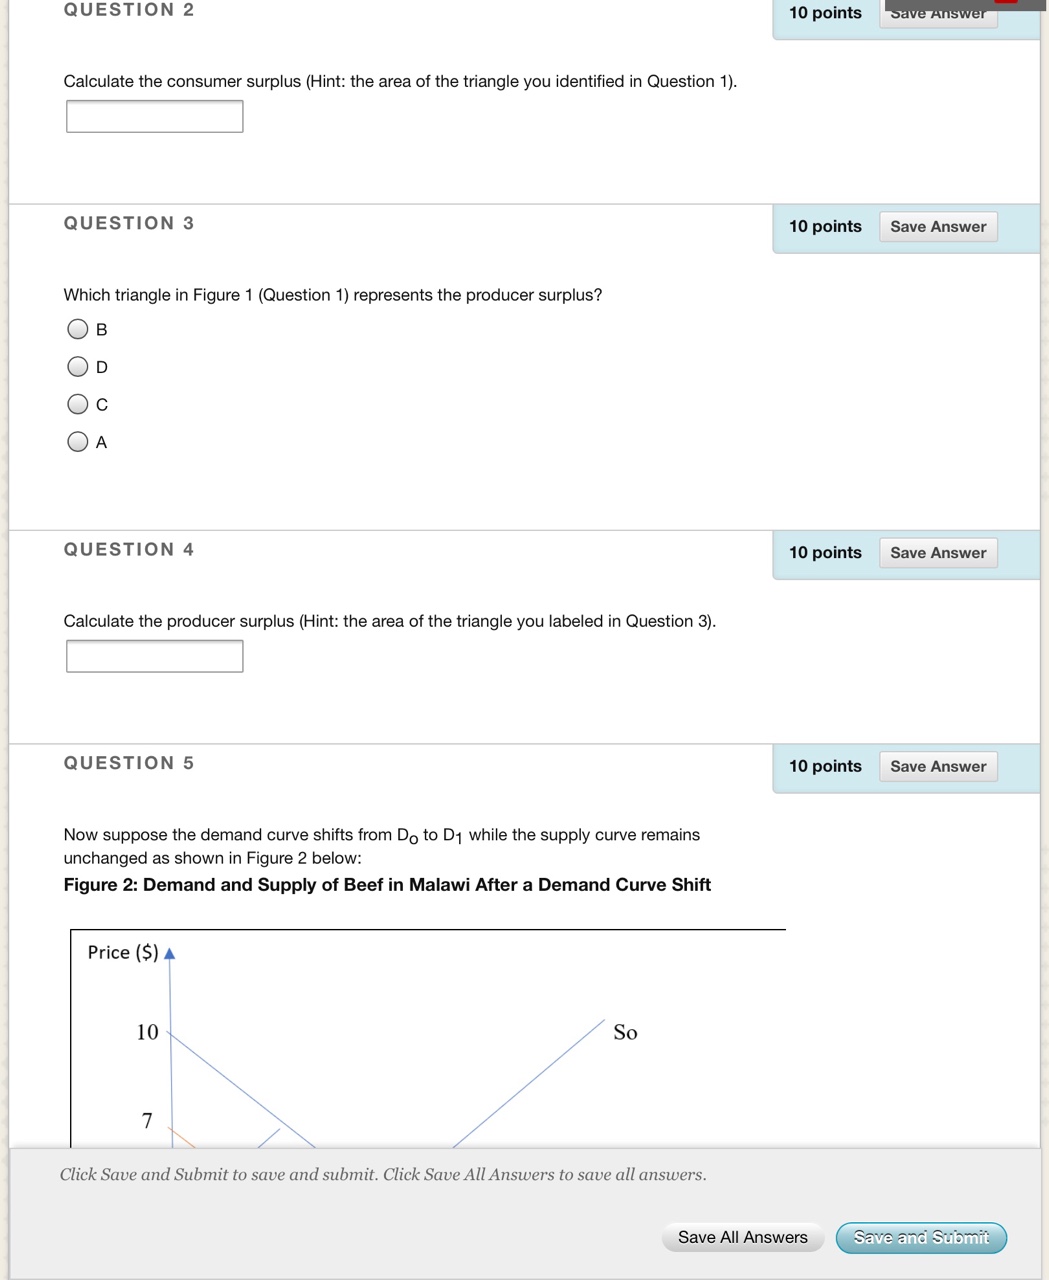
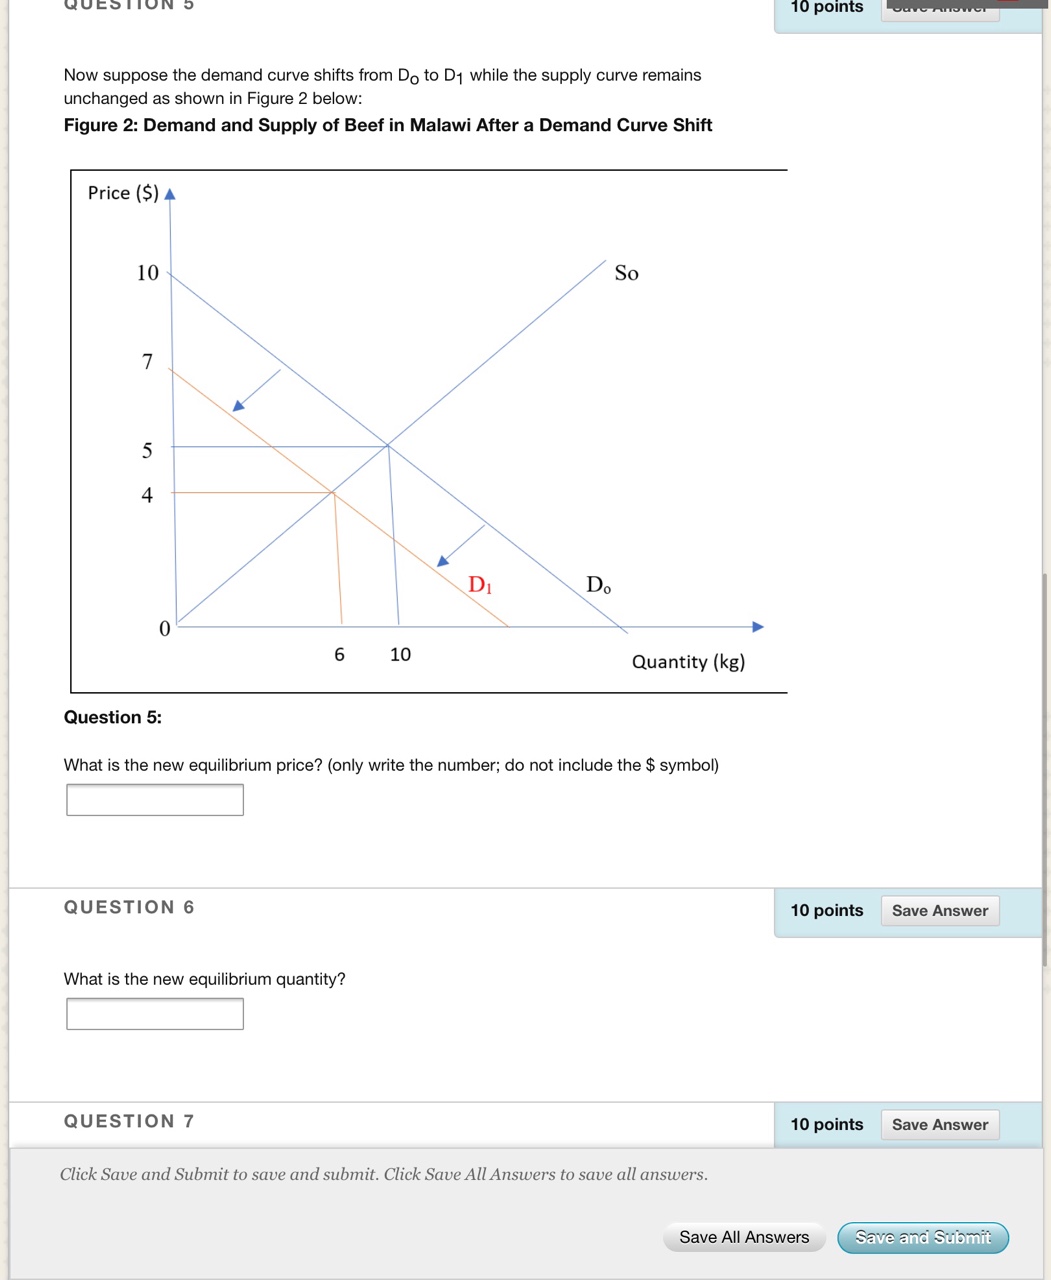
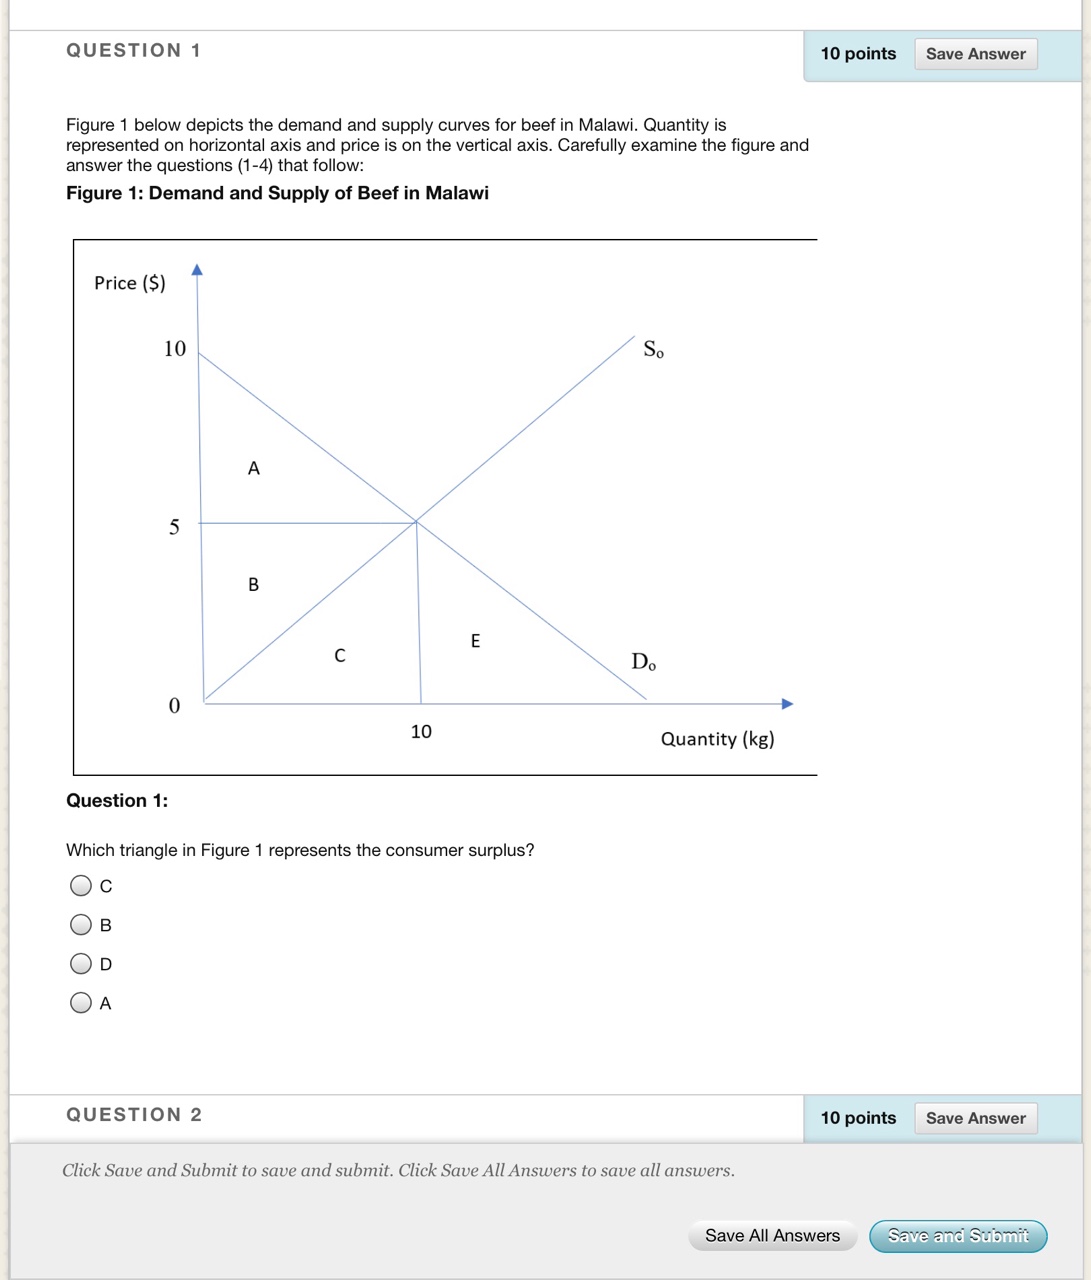
QUESTION 2 10 points Save Answer Calculate the consumer surplus (Hint: the area of the triangle you identified in Question 1). QUESTION 3 10 points Save Answer Which triangle in Figure 1 (Question 1) represents the producer surplus? O B OD O c OA QUESTION 4 10 points Save Answer Calculate the producer surplus (Hint: the area of the triangle you labeled in Question 3). QUESTION 5 10 points Save Answer Now suppose the demand curve shifts from Do to D1 while the supply curve remains unchanged as shown in Figure 2 below: Figure 2: Demand and Supply of Beef in Malawi After a Demand Curve Shift Price ($) A 10 So Click Save and Submit to save and submit. Click Save All Answers to save all answers. Save All Answers Save and Submit10 points Now suppose the demand curve shifts from Do to D1 while the supply curve remains unchanged as shown in Figure 2 below: Figure 2: Demand and Supply of Beef in Malawi After a Demand Curve Shift Price ($) A 10 So 7 UI -A DI Do 6 10 Quantity (kg) Question 5: What is the new equilibrium price? (only write the number; do not include the $ symbol) QUESTION 6 10 points Save Answer What is the new equilibrium quantity? QUESTION 7 10 points Save Answer Click Save and Submit to save and submit. Click Save All Answers to save all answers. Save All Answers Save and SubmitQUESTION 7 10 points Save Answer Calculate the consumer surplus after the shift in the demand curve. QUESTION 8 10 points Save Answer Calculate the producer surplus after the shift in the demand curve. QUESTION 9 10 points Save Answer Which group is better off after the shift in the demand curve? Producers only Consumers only Both producers and consumers Neither producers nor consumers QUESTION 10 10 points Save Answer What is a possible reason for the shift in the demand curve to the left? Population increase Decrease in income Reduction of the production cost of the goods None of the above Click Save and Submit to save and submit. Click Save All Answers to save all answers. Save All Answers Save and SubmitQUESTION 1 10 points Save Answer Figure 1 below depicts the demand and supply curves for beef in Malawi. Quantity is represented on horizontal axis and price is on the vertical axis. Carefully examine the figure and answer the questions (1-4) that follow: Figure 1: Demand and Supply of Beef in Malawi Price ($) 10 So A 5 B E C Do 10 Quantity (kg) Question 1: Which triangle in Figure 1 represents the consumer surplus? O c OB OD OA QUESTION 2 10 points Save Answer Click Save and Submit to save and submit. Click Save All Answers to save all answers. Save All Answers Save and Submit
Step by Step Solution
There are 3 Steps involved in it

Get step-by-step solutions from verified subject matter experts