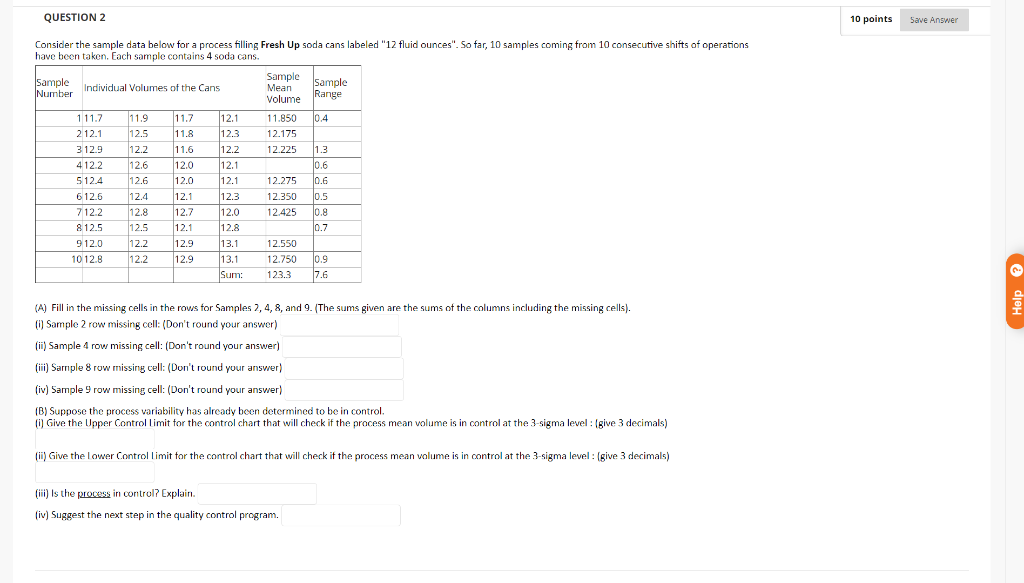
Question: QUESTION 2 10 points Save Answer Consider the sample data below for a process filling Fresh Up soda cans labeled 12 fluid Ounces. So far,

QUESTION 2 10 points Save Answer Consider the

QUESTION 2 10 points Save Answer Consider the sample data below for a process filling Fresh Up soda cans labeled "12 fluid Ounces". So far, 10 samples coming from 10 consecutive shifts of operations have been taken. Each sample contains 4 soda cans. Sample Sample Sample Individual Volumes of the Cans Number Mean Volume Range 111.7 11.9 11.7 12.1 11.850 10.4 212.1 12.5 11.8 112.3 12.175 312.9 12.2 11.6 12.2 12.225 1.3 4122 12.6 12.0 12.1 10.6 5124 12.6 12.0 12.275 6126 12.4 12.1 12.3 12.350 0.5 7122 12.8 12.7 112.0 12.425 0.8 649 8125 12.5 12.1 12.8 0.7 9120 12.2 12.9 13.1 12.550 1012.8 12.2 12.9 13.1 12.750 0.9 Sum: 123.3 7.6 12.1 10.6 (A) Fill in the missing cells in the rows for Samples 2, 4, 8, and 9. (The sums given are the sums of the columns including the missing cells). 0 Sample 2 row missing cell: (Don't round your answer) (i) Sample 4 row missing cell: (Don't round your answer) (ii) Sarriple 8 row missing cell: (Don't round your answer) (iv) Sample 9 row missing cell: (Don't round your answer) (B) Suppose the process variability has already been determined to be in control. Give the Upper Control Limit for the control chart that will check if the process mean volume is in control at the 3-sigma level : (give 3 decimals) (ii) Give the lower Controllimit for the control chart that will check if the process mean volume is in control at the 3-sigma level: (give 3 decimals) (ii) is the process in control? Explain. (iv) Suggest the next step in the quality control program

Step by Step Solution

There are 3 Steps involved in it

1 Expert Approved Answer
Step: 1 Unlock blur-text-image
Question Has Been Solved by an Expert!

Get step-by-step solutions from verified subject matter experts

Step: 2 Unlock
Step: 3 Unlock

Students Have Also Explored These Related General Management Questions!