

Question: Please show all work! Thank you Consider the sample data below for a process filling Very Nice soda cans labeled 12 fluid Ounces. So far,
Please show all work! Thank you
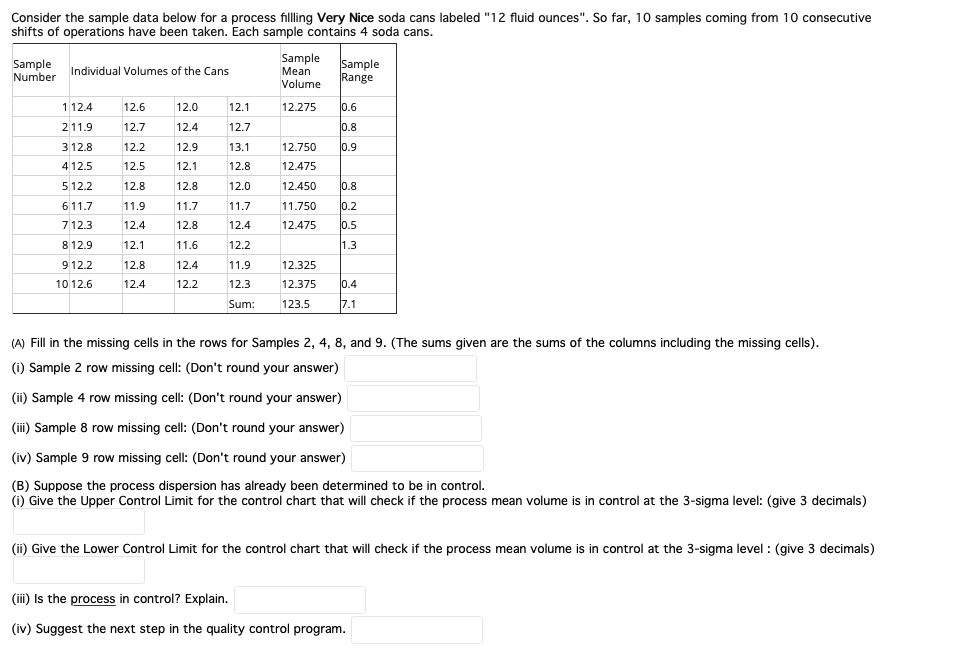
Consider the sample data below for a process filling Very Nice soda cans labeled "12 fluid Ounces". So far, 10 samples coming from 10 consecutive shifts of operations have been taken. Each sample contains 4 soda cans. Sample Sample Number Sample Individual Volumes of the Cans Mean Range Volume 1 12.4 12.6 12.0 12.1 12.275 0.6 2 11.9 12.7 12.4 12.7 0.8 12.2 12.9 13.1 10.9 3 12.8 412.5 12.750 12.475 12.5 12.1 12.8 5 12.2 12.8 12.8 12.0 12.450 0.8 6 11.7 11.9 11.7 11.7 11.750 0.2 0.5 12.8 12.4 12.475 7 12.3 812.9 12.4 12.1 11.6 12.2 1.3 12.8 12.4 12.325 9 12.2 10 12.6 11.9 12.3 12.4 12.2 12.375 10.4 Sum: 123.5 7.1 (A) Fill in the missing cells in the rows for Samples 2, 4, 8, and 9. (The sums given are the sums of the columns including the missing cells). (i) Sample 2 row missing cell: (Don't round your answer) (ii) Sample 4 row missing cell: (Don't round your answer) (iii) Sample 8 row missing cell: (Don't round your answer) (iv) Sample 9 row missing cell: (Don't round your answer) (B) Suppose the process dispersion has already been determined to be in control. (0) Give the Upper Control Limit for the control chart that will check if the process mean volume is in control at the 3-sigma level: (give 3 decimals) (i) Give the Lower Control Limit for the control chart that will check if the process mean volume is in control at the 3-sigma level : (give 3 decimals) (iii) is the process in control? Explain. (iv) Suggest the next step in the quality control programStep by Step Solution
There are 3 Steps involved in it
1 Expert Approved Answer
Step: 1 Unlock

Question Has Been Solved by an Expert!
Get step-by-step solutions from verified subject matter experts
Step: 2 Unlock
Step: 3 Unlock