

Question: Question 2 (10 points) Using the financial information provided in Tables 1 & 2, what is the common-size income statement value of net income in
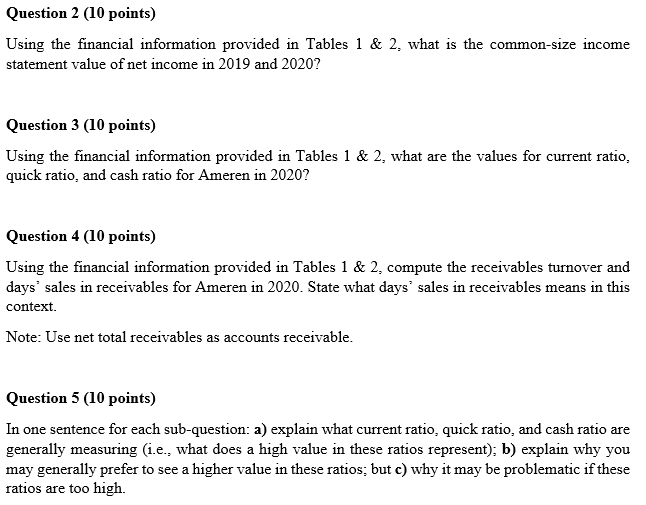
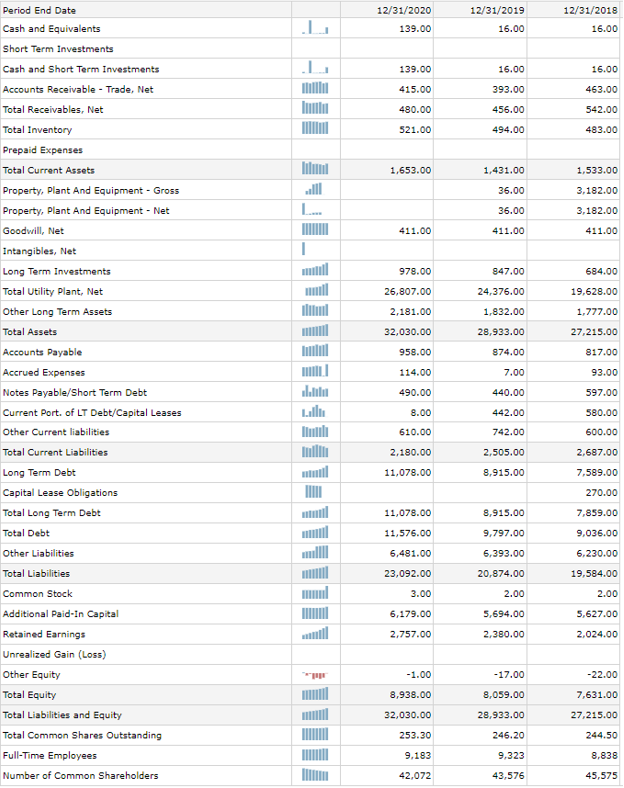
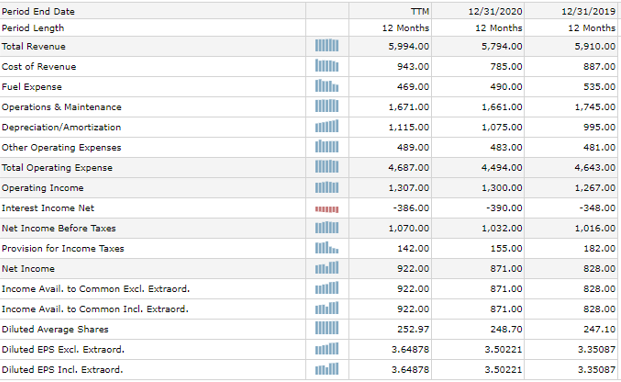
Question 2 (10 points) Using the financial information provided in Tables 1 & 2, what is the common-size income statement value of net income in 2019 and 2020? Question 3 (10 points) Using the financial information provided in Tables 1 & 2, what are the values for current ratio, quick ratio, and cash ratio for Ameren in 2020? Question 4 (10 points) Using the financial information provided in Tables 1 & 2, compute the receivables turnover and days' sales in receivables for Ameren in 2020. State what days' sales in receivables means in this context. Note: Use net total receivables as accounts receivable. Question 5 (10 points) In one sentence for each sub-question: a) explain what current ratio, quick ratio, and cash ratio are generally measuring (i.e., what does a high value in these ratios represent); b) explain why you may generally prefer to see a higher value in these ratios; but c) why it may be problematic if these ratios are too high 12/31/2018 12/31/2020 139.00 12/31/2019 16.00 16.00 . 139.00 16.00 16.00 415.00 393.00 463.00 480.00 456.00 542.00 521.00 494.00 483.00 lilul 1,653.00 1,431.00 1,533.00 36.00 3,182.00 L... 36.00 3,182.00 411.00 411.00 411.00 I 978.00 847.00 684.00 26,807.00 24,376.00 19,628.00 2,181.00 1,832.00 1,777.00 32,030.00 28,933.00 27,215.00 958.00 874.00 817.00 114.00 7.00 93.00 Period End Date Cash and Equivalents Short Term Investments Cash and Short Term Investments Accounts Receivable - Trade, Net Total Receivables, Net Total Inventory Prepaid Expenses Total Current Assets Property, Plant And Equipment - Gross Property, Plant And Equipment - Net Goodwill, Net Intangibles, Net Long Term Investments Total Utility Plant, Net Other Long Term Assets Total Assets Accounts Payable Accrued Expenses Notes Payable/Short Term Debt Current Port of LT Debt/Capital Leases Other Current liabilities Total Current Liabilities Long Term Debt Capital Lease Obligations Total Long Term Debt Total Debt Other Liabilities Total Liabilities Common Stock Additional Paid-in Capital Retained Earnings Unrealized Gain (Loss) Other Equity Total Equity Total Liabilities and Equity Total Common Shares Outstanding Full-Time Employees Number of Common Shareholders Labai 490.00 440.00 597.00 8.00 442.00 580.00 610.00 742.00 600.00 2,180.00 2,505.00 2,687.00 11,078.00 8,915.00 7,589.00 270.00 11,078.00 8,915.00 7,859.00 11,576.00 9,797.00 9,036.00 6,481.00 6,393.00 6.230.00 23,092.00 20,874.00 19,584.00 3.00 2.00 2.00 6,179.00 5,694.00 5,627.00 2,757.00 2,380.00 2.024.00 -1.00 -17.00 -22.00 8,938.00 8,059.00 7,631.00 32,030.00 28,933.00 27,215.00 253.30 246.20 244.50 9.183 9,323 8,838 42,072 43,576 45,575 TTM 12 Months 12/31/2020 12 Months 5,794.00 12/31/2019 12 Months 5.910.00 5,994.00 943.00 785.00 887.00 469.00 490.00 535.00 1,671.00 1,661.00 1,745.00 1,115.00 1.075.00 995.00 489.00 483.00 481.00 4,687.00 4,494.00 4,643.00 Period End Date Period Length Total Revenue Cost of Revenue Fuel Expense Operations & Maintenance Depreciation/Amortization Other Operating Expenses Total Operating Expense Operating Income Interest Income Net Net Income Before Taxes Provision for Income Taxes Net Income Income Avail. to Common Excl. Extraord. Income Avail. to Common Incl. Extraord. Diluted Average Shares Diluted EPS Excl. Extraord. Diluted EPS Incl. Extraord. 1,307.00 1,300.00 1,267.00 -386.00 -390.00 -348.00 1,070.00 1,032.00 1,016.00 142.00 155.00 182.00 922.00 871.00 828.00 922.00 871.00 828.00 922.00 871.00 828.00 252.97 248.70 247.10 3.64878 3.50221 3.35087 3.64878 3.50221 3.35087 Question 2 (10 points) Using the financial information provided in Tables 1 & 2, what is the common-size income statement value of net income in 2019 and 2020? Question 3 (10 points) Using the financial information provided in Tables 1 & 2, what are the values for current ratio, quick ratio, and cash ratio for Ameren in 2020? Question 4 (10 points) Using the financial information provided in Tables 1 & 2, compute the receivables turnover and days' sales in receivables for Ameren in 2020. State what days' sales in receivables means in this context. Note: Use net total receivables as accounts receivable. Question 5 (10 points) In one sentence for each sub-question: a) explain what current ratio, quick ratio, and cash ratio are generally measuring (i.e., what does a high value in these ratios represent); b) explain why you may generally prefer to see a higher value in these ratios; but c) why it may be problematic if these ratios are too high 12/31/2018 12/31/2020 139.00 12/31/2019 16.00 16.00 . 139.00 16.00 16.00 415.00 393.00 463.00 480.00 456.00 542.00 521.00 494.00 483.00 lilul 1,653.00 1,431.00 1,533.00 36.00 3,182.00 L... 36.00 3,182.00 411.00 411.00 411.00 I 978.00 847.00 684.00 26,807.00 24,376.00 19,628.00 2,181.00 1,832.00 1,777.00 32,030.00 28,933.00 27,215.00 958.00 874.00 817.00 114.00 7.00 93.00 Period End Date Cash and Equivalents Short Term Investments Cash and Short Term Investments Accounts Receivable - Trade, Net Total Receivables, Net Total Inventory Prepaid Expenses Total Current Assets Property, Plant And Equipment - Gross Property, Plant And Equipment - Net Goodwill, Net Intangibles, Net Long Term Investments Total Utility Plant, Net Other Long Term Assets Total Assets Accounts Payable Accrued Expenses Notes Payable/Short Term Debt Current Port of LT Debt/Capital Leases Other Current liabilities Total Current Liabilities Long Term Debt Capital Lease Obligations Total Long Term Debt Total Debt Other Liabilities Total Liabilities Common Stock Additional Paid-in Capital Retained Earnings Unrealized Gain (Loss) Other Equity Total Equity Total Liabilities and Equity Total Common Shares Outstanding Full-Time Employees Number of Common Shareholders Labai 490.00 440.00 597.00 8.00 442.00 580.00 610.00 742.00 600.00 2,180.00 2,505.00 2,687.00 11,078.00 8,915.00 7,589.00 270.00 11,078.00 8,915.00 7,859.00 11,576.00 9,797.00 9,036.00 6,481.00 6,393.00 6.230.00 23,092.00 20,874.00 19,584.00 3.00 2.00 2.00 6,179.00 5,694.00 5,627.00 2,757.00 2,380.00 2.024.00 -1.00 -17.00 -22.00 8,938.00 8,059.00 7,631.00 32,030.00 28,933.00 27,215.00 253.30 246.20 244.50 9.183 9,323 8,838 42,072 43,576 45,575 TTM 12 Months 12/31/2020 12 Months 5,794.00 12/31/2019 12 Months 5.910.00 5,994.00 943.00 785.00 887.00 469.00 490.00 535.00 1,671.00 1,661.00 1,745.00 1,115.00 1.075.00 995.00 489.00 483.00 481.00 4,687.00 4,494.00 4,643.00 Period End Date Period Length Total Revenue Cost of Revenue Fuel Expense Operations & Maintenance Depreciation/Amortization Other Operating Expenses Total Operating Expense Operating Income Interest Income Net Net Income Before Taxes Provision for Income Taxes Net Income Income Avail. to Common Excl. Extraord. Income Avail. to Common Incl. Extraord. Diluted Average Shares Diluted EPS Excl. Extraord. Diluted EPS Incl. Extraord. 1,307.00 1,300.00 1,267.00 -386.00 -390.00 -348.00 1,070.00 1,032.00 1,016.00 142.00 155.00 182.00 922.00 871.00 828.00 922.00 871.00 828.00 922.00 871.00 828.00 252.97 248.70 247.10 3.64878 3.50221 3.35087 3.64878 3.50221 3.35087
Step by Step Solution
There are 3 Steps involved in it

Get step-by-step solutions from verified subject matter experts