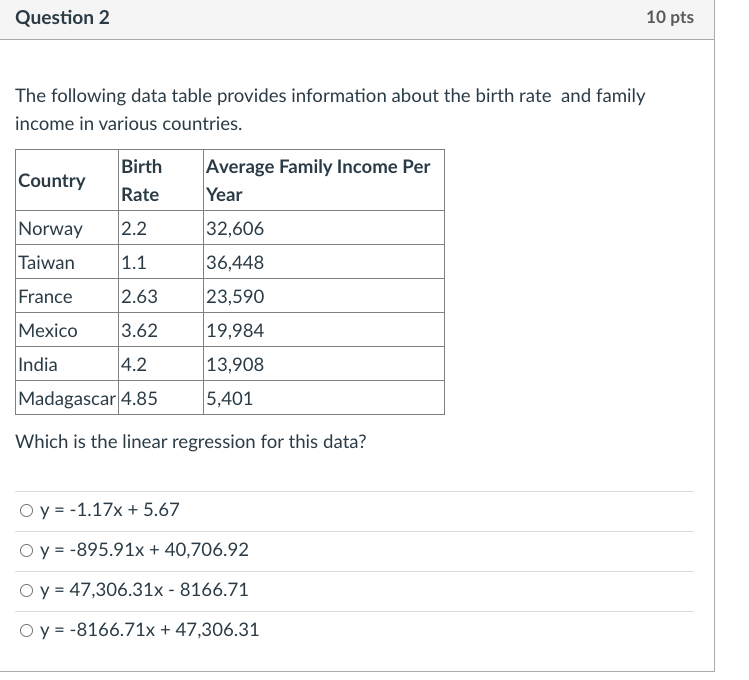
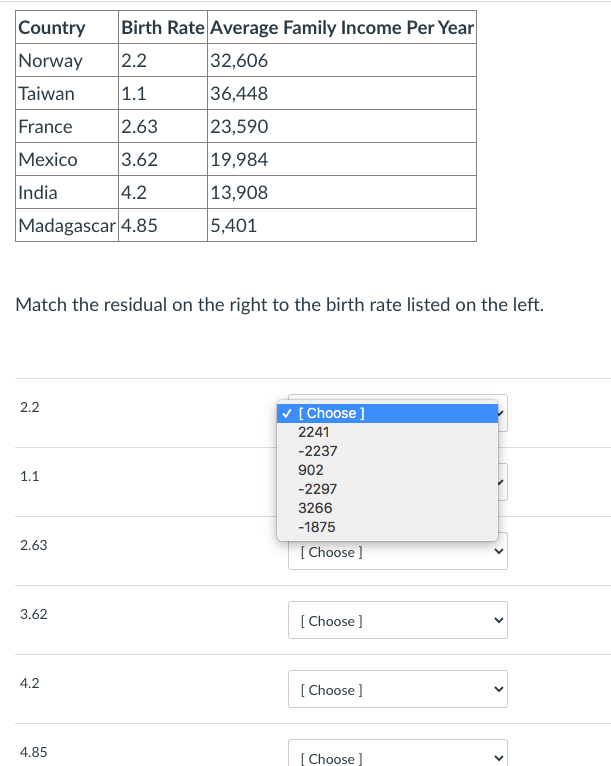
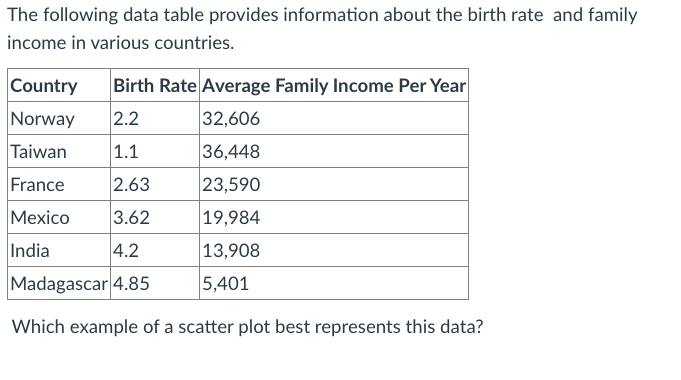
Question: Question 2 10 pts The following data table provides information about the birth rate and family income in various countries. Birth Average Family Income Per

Question 2 10 pts The following data tableQuestion 2 10 pts The following data tableQuestion 2 10 pts The following data tableQuestion 2 10 pts The following data tableQuestion 2 10 pts The following data tableQuestion 2 10 pts The following data tableQuestion 2 10 pts The following data table
Question 2 10 pts The following data table provides information about the birth rate and family income in various countries. Birth Average Family Income Per Country Rate Year Norway 2.2 32,606 Taiwan 1.1 36,448 France 2.63 23,590 Mexico 3.62 19,984 India 4.2 13,908 Madagascar 4.85 5,401 Which is the linear regression for this data? O y = -1.17x + 5.67 Oy = -895.91x + 40,706.92 O y = 47,306.31x - 8166.71 Oy = -8166.71x + 47,306.31Country Birth Rate Average Family Income Per Year Norway 2.2 32,606 Taiwan 1.1 36,448 France 2.63 23,590 Mexico 3.62 19,984 India 4.2 13,908 Madagascar 4.85 5,401 Match the residual on the right to the birth rate listed on the left. 2.2 [ Choose ] 2241 -2237 1.1 902 -2297 3266 -1875 2.63 [ Choose ] 3.62 [ Choose ] v 4.2 [ Choose ] 4.85 [Choose ]Based on the residual plot, is the model a good t for the data? Explain. 4o D The linear model is a good t because the residual plot looks linear. (I) The linear model is not a good t because the residual plot is scattered. C) The linear model is not a good t because the residual plot looks linear. D The linear model is a good t because the residual plot is scattered. Question 10 10 pts Explain how you use a residual plot to determine if your regression model is a good fit for the data. Edit View Insert Format Tools Table 12pt Paragraph BIUAVQuestion 6 10 pts Scientists researching crickets have observed that the rate at which a certain species chirps may be related to their surrounding temperature. The table below contains chirping rates of crickets for various temperatures. EmEta-311']he\".\"all\" Find the residual plot for the linear regression model of temperature and chirping rate. Question 5 10 pts Scientists researching crickets have observed that the rate at which a certain species chirps may,f be related to their surrounding temperature. The table below contains chirping rates of crickets for various temperatures. 140 Find the scatter plot for the relationship between temperature and chirping rate. The following data table provides information about the birth rate and family income in various countries. m- Which example of a scatter plot best represents this data

Step by Step Solution

There are 3 Steps involved in it

1 Expert Approved Answer
Step: 1 Unlock blur-text-image
Question Has Been Solved by an Expert!

Get step-by-step solutions from verified subject matter experts

Step: 2 Unlock
Step: 3 Unlock

Students Have Also Explored These Related Mathematics Questions!