

Question: QUESTION 2 11 points Live Jisaur Use (Sheet no. 15) in the attached excel file and the following equation (RL + R) data for exp#7
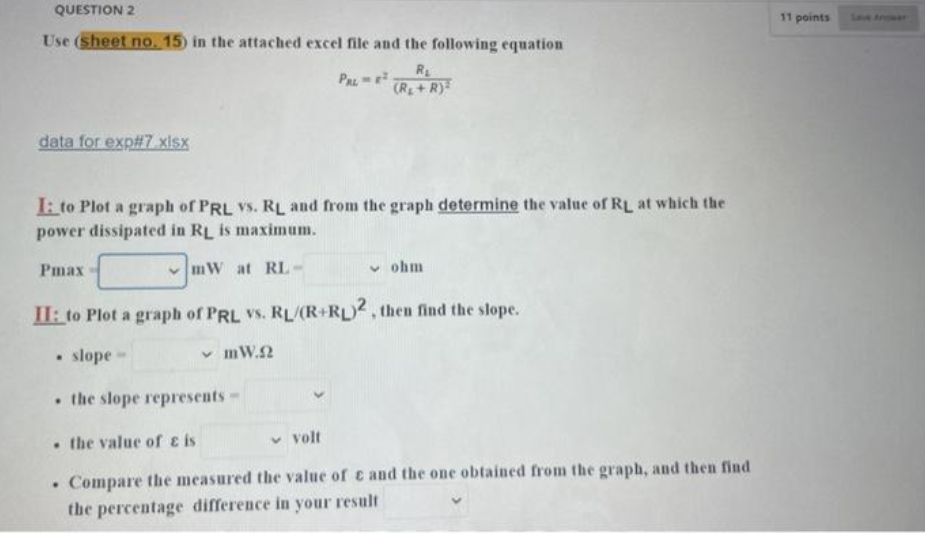
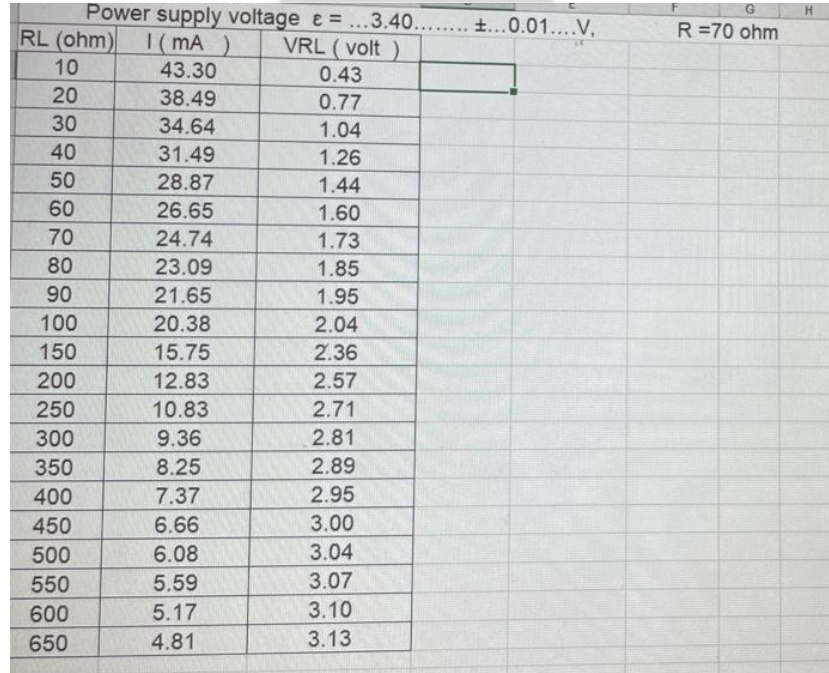


QUESTION 2 11 points Live Jisaur Use (Sheet no. 15) in the attached excel file and the following equation (RL + R) data for exp#7 xisx I: to Plot a graph of PRL VS. RL and from the graph determine the value of RL at which the power dissipated in RL is maximum. Pmax mW at RL- v ohm II: to Plot a graph of PRL VS. RL/(R+RL)2 , then find the slope. . slope mW.Q . the slope represents - . the value of & is v volt . Compare the measured the value of c and the one obtained from the graph, and then find the percentage difference in your result
Step by Step Solution
There are 3 Steps involved in it
1 Expert Approved Answer
Step: 1 Unlock

Question Has Been Solved by an Expert!
Get step-by-step solutions from verified subject matter experts
Step: 2 Unlock
Step: 3 Unlock