

Question: Question 2 (14 marks; length guide: about 2-3 pages including graphs) Suppose that the production function for output in an economy is given by Y,
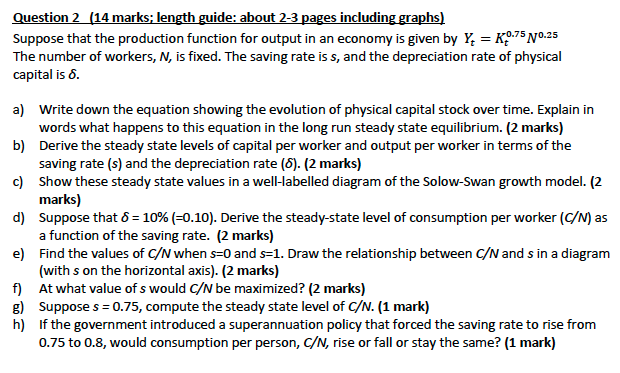
Question 2 (14 marks; length guide: about 2-3 pages including graphs) Suppose that the production function for output in an economy is given by Y, = KO-75 /0.25 The number of workers, N, is fixed. The saving rate is s, and the depreciation rate of physical capital is 6. a) Write down the equation showing the evolution of physical capital stock over time. Explain in words what happens to this equation in the long run steady state equilibrium. (2 marks) b) Derive the steady state levels of capital per worker and output per worker in terms of the saving rate (s) and the depreciation rate (6). (2 marks) c) Show these steady state values in a well-labelled diagram of the Solow-Swan growth model. (2 marks) d) Suppose that 6 = 10% (=0.10). Derive the steady-state level of consumption per worker (C/N) as a function of the saving rate. (2 marks) e) Find the values of CN when s=0 and s=1. Draw the relationship between CN and s in a diagram (with s on the horizontal axis). (2 marks) f) At what value of s would CN be maximized? (2 marks) g) Supposes =0.75, compute the steady state level of C/N. (1 mark) h) If the government introduced a superannuateon policy that forced the saving rate to rise from 0.75 to 0.8, would consumption per person, C/N, rise or fall or stay the same? (1 mark)
Step by Step Solution
There are 3 Steps involved in it

Get step-by-step solutions from verified subject matter experts