

Question: QUESTION 2 2 . 1 An assembly line whose activities are shown in the table below has a demand of 4 5 units per day.
QUESTION
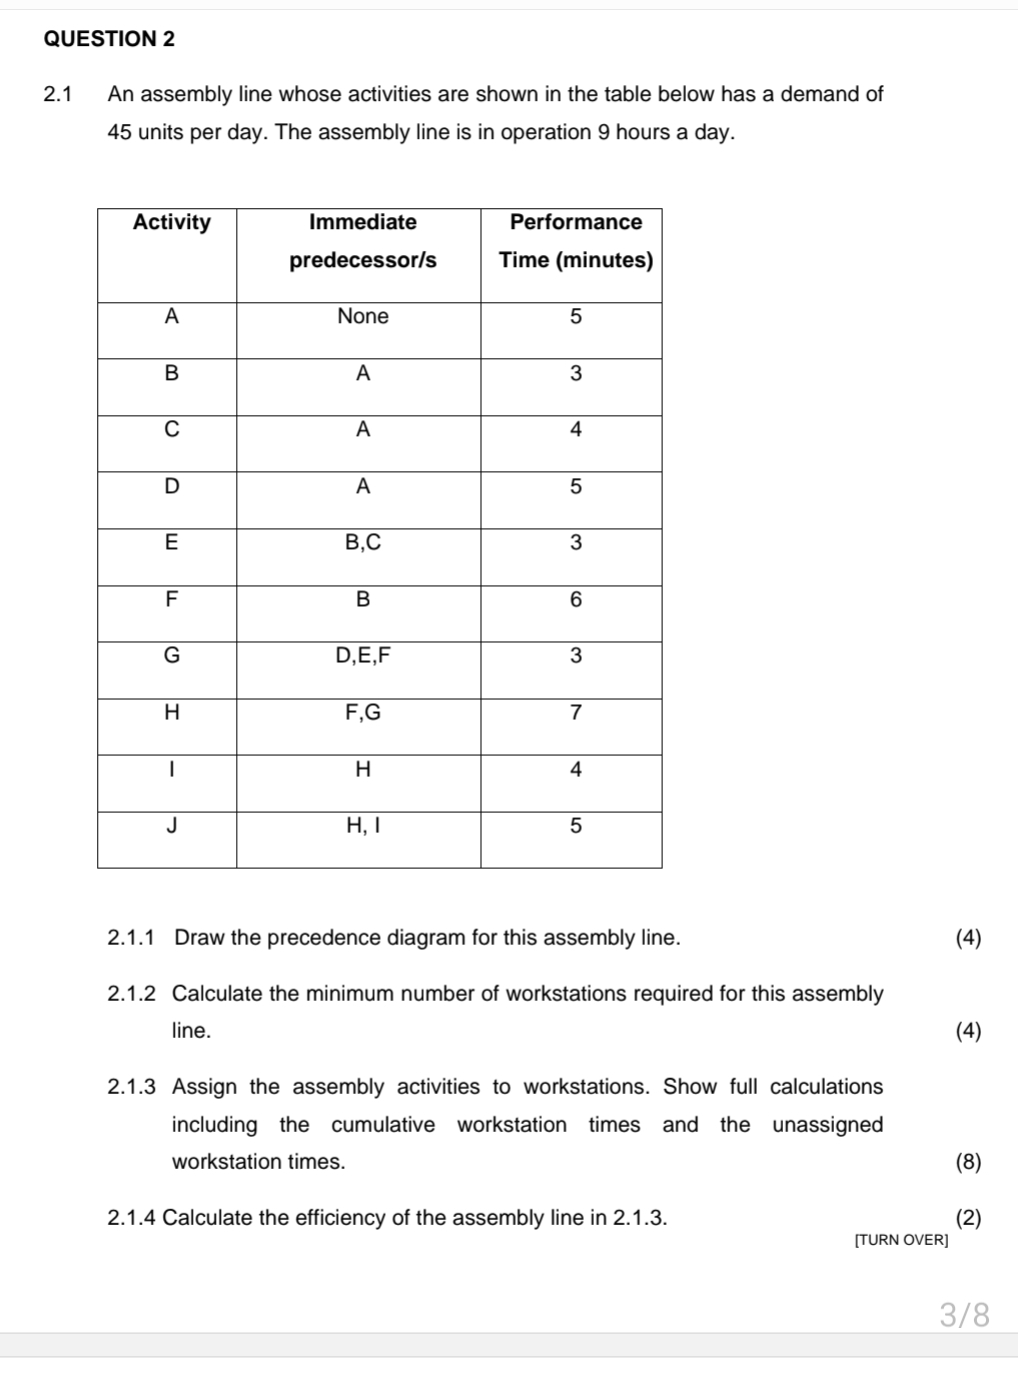
An assembly line whose activities are shown in the table below has a demand of units per day. The assembly line is in operation hours a day.
tableActivitytableImmediatepredecessorstablePerformanceTime minutesANone,BACADAEBCFBGDEFHFGIHJH I,
Draw the precedence diagram for this assembly line.
Calculate the minimum number of workstations required for this assembly line.
Assign the assembly activities to workstations. Show full calculations including the cumulative workstation times and the unassigned workstation times.
Calculate the efficiency of the assembly line in
TURN OVER
Step by Step Solution
There are 3 Steps involved in it
1 Expert Approved Answer
Step: 1 Unlock

Question Has Been Solved by an Expert!
Get step-by-step solutions from verified subject matter experts
Step: 2 Unlock
Step: 3 Unlock