

Question: Question 2 ( 2 5 marks ) : A large production well has been installed in a confined aquifer to supply water for a municipality
Question marks: A large production well has been installed in a confined aquifer to supply water for a municipality in Nova Scotia. A series of observation wells have been installed see Figure below in the same aquifer at distances of and from the pumping well. A pumping test was conducted over a hour period, but you are hesitant to analyze the drawdown data because fluctuations in the pumping rate caused water levels to fluctuate in the observation wells. Fortunately, you were able to record the total drawdown in all wells at the end of the hour pumping period and you also recorded the water level recovery in the pumping well for an additional hour period. These data points are shown in Tables and below.
a Plot a graph of drawdown versus distance using data from the four observation wells at the end of the pumping period ie distancedrawdown method Using an average pumping rate of over the pumping period, estimate the transmissivity and storativity of the aquifer from this method. Given that the aquifer thickness is estimate the horizontal hydraulic conductivity using the calculated transmissivity, and speculate on the geological material that the aquifer is comprised of marks
b Calculate the drawdown in the pumping well at the end of the hour pumping period. Assume the pumping well has an effective radius of Would you expect the actual drawdown in the pumping well to be greater than or less than the theoretical value you calculated? Explain your answer. marks
c Using the recovery data from the pumping well, plot a graph of residual drawdown versus time ratio Using the plotted data, estimate the transmissivity of the aquifer. marks
d Comment on the shape of the recovery curve at large recovery times ie small values of What does it suggest about the hydraulic response of the aquifer? marks
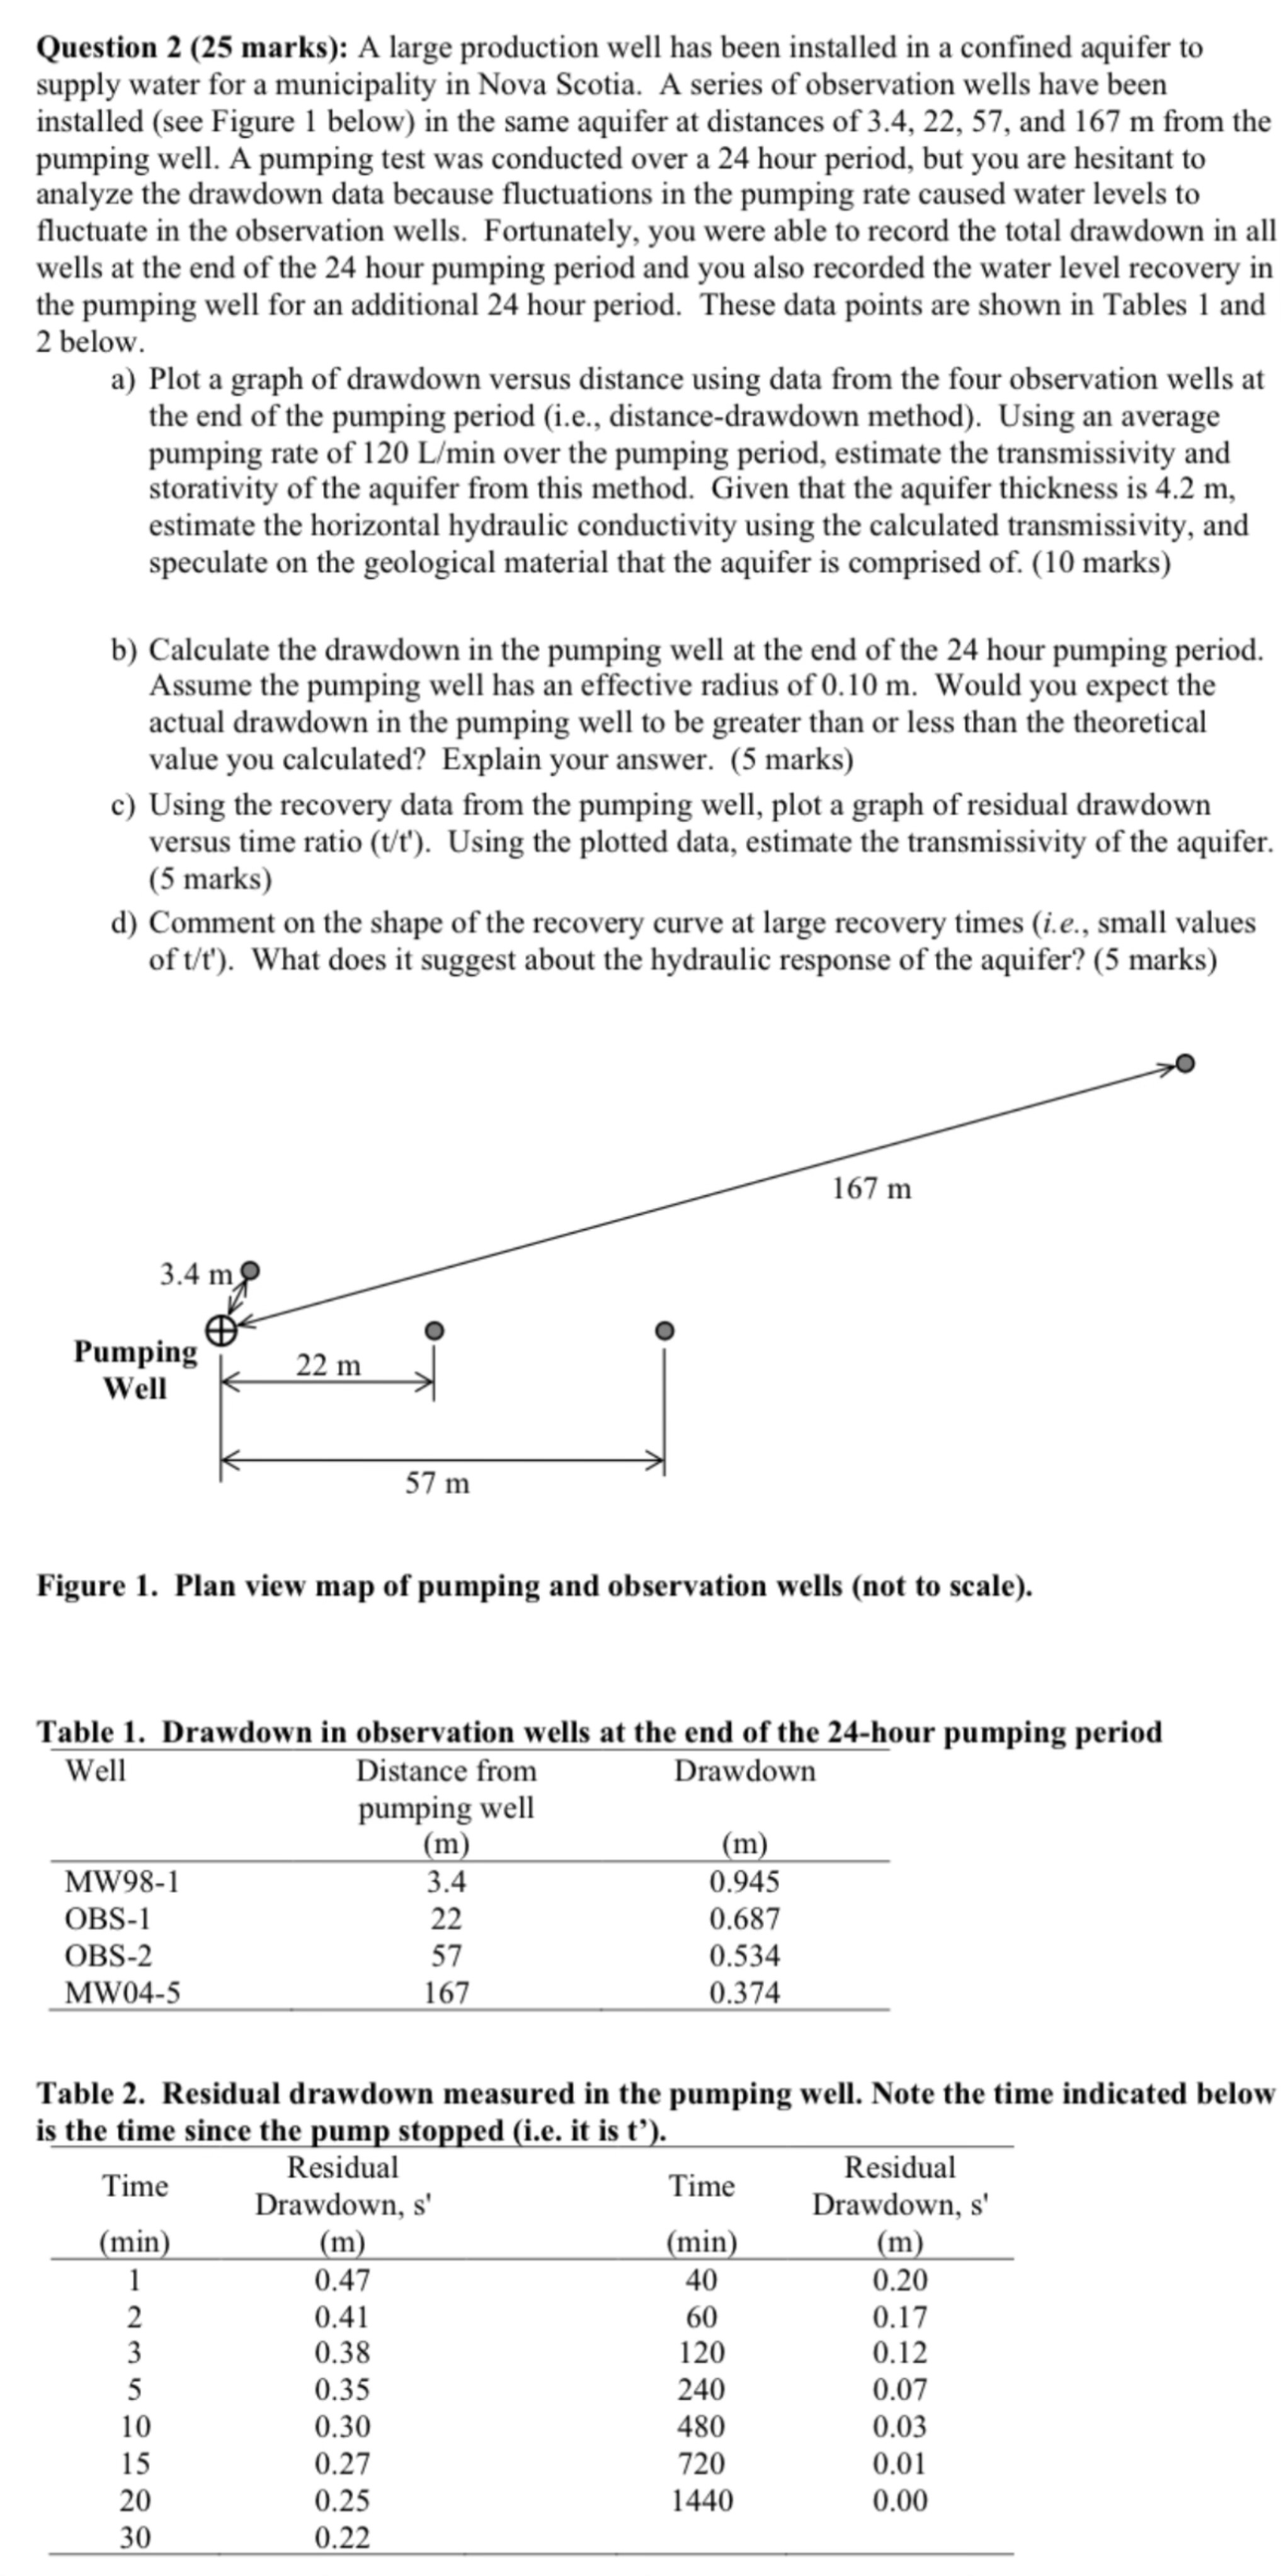
Figure Plan view map of pumping and observation wells not to scale
Table Drawdown in observation wells at the end of the hour pumping period
tableWelltableDistance frompumping well
Step by Step Solution
There are 3 Steps involved in it
1 Expert Approved Answer
Step: 1 Unlock

Question Has Been Solved by an Expert!
Get step-by-step solutions from verified subject matter experts
Step: 2 Unlock
Step: 3 Unlock