

Question: Question 2 (2) Analyse the data tables and determine the following: The day and time the lower threshold was breached for the first time. The
Question 2 (2) Analyse the data tables and determine the following: The day and time the lower threshold was breached for the first time. The day and time the upper threshold was breached for the first time. Question 3 (14) Ideally, the psi should have been monitored as a key risk indicator. Discuss the concept of a key risk indicator (KRI) as a typical operational risk management methodology in detail. Indicate by means of a line graph the behaviour of the psi for days 5 and 6, indicating the thresholds and the times when the chief engineer should have taken emergency measures. Question 4 (14) Illustrate by means of an appropriate graph (column) the status of the psi on each day at 09h00, 14h00 and 20h00. Interpret the graph and submit concluding remarks to top management on the status of the psi on each day. Indicate the thresholds clearly and determine when the crew should have alerted the chief engineer of a potential problem with the psi.
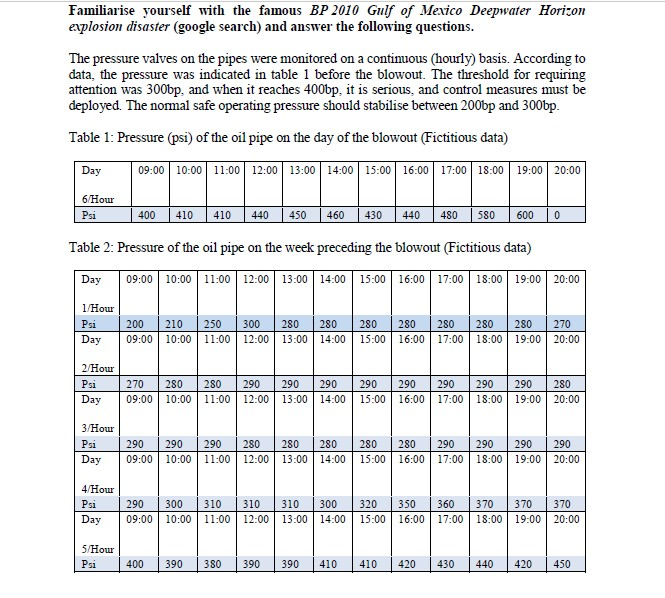
Familiarise yourself with the famous BP 2010 Gulf of Mexico Deepwater Horizon explosion disaster (google search) and answer the following questions. The pressure valves on the pipes were monitored on a continuous (hourly) basis. According to data, the pressure was indicated in table 1 before the blowout. The threshold for requiring attention was 300bp, and when it reaches 400bp, it is serious, and control measures must be deployed. The normal safe operating pressure should stabilise between 200bp and 300bp. Table 1: Pressure (psi) of the oil pipe on the day of the blowout (Fictitious data) Day 09:00 10:00 11:00 12:00 13:00 14:00 15:00 16:00 17:00 18:00 19:00 20:00 6/Hour Psi 400 410 410 440 450 460 430 440 480 580 600 0 Table 2: Pressure of the oil pipe on the week preceding the blowout (Fictitious data) Day 09:00 10:00 11:00 12:00 13:00 14:00 15:00 16:00 17:00 18:00 19:00 20:00 1 Hour Psi Day 200 09:00 210 10:00 250 11:00 300 12:00 280 280 13:00 14:00 280 280 15:00 16:00 280 17:00 280 18:00 280 19:00 270 20:00 2 Hour Psi Day 270 280 280 09:00 10:00 11:00 290 290 12:00 13:00 290 14:00 290 15:00 290 16:00 290 17:00 290 18:00 290 280 19:00 20:00 3 Hour Psi Day 290 290 290 09:00 10:00 11:00 280 12:00 280 280 13:00 14:00 280 280 15:00 16:00 290 290 17:00 18:00 290 19:00 290 20:00 4 Hour Psi 290 300 09:00 10:00 310 11:00 310 12:00 310 300 13:00 14:00 320 350 15:00 16:00 360 370 17:00 18:00 370 370 19:00 20:00 Day 5/Hour Psi 400 390 380 390 390 410 410 420 430 440 420 450Step by Step Solution
There are 3 Steps involved in it

Get step-by-step solutions from verified subject matter experts