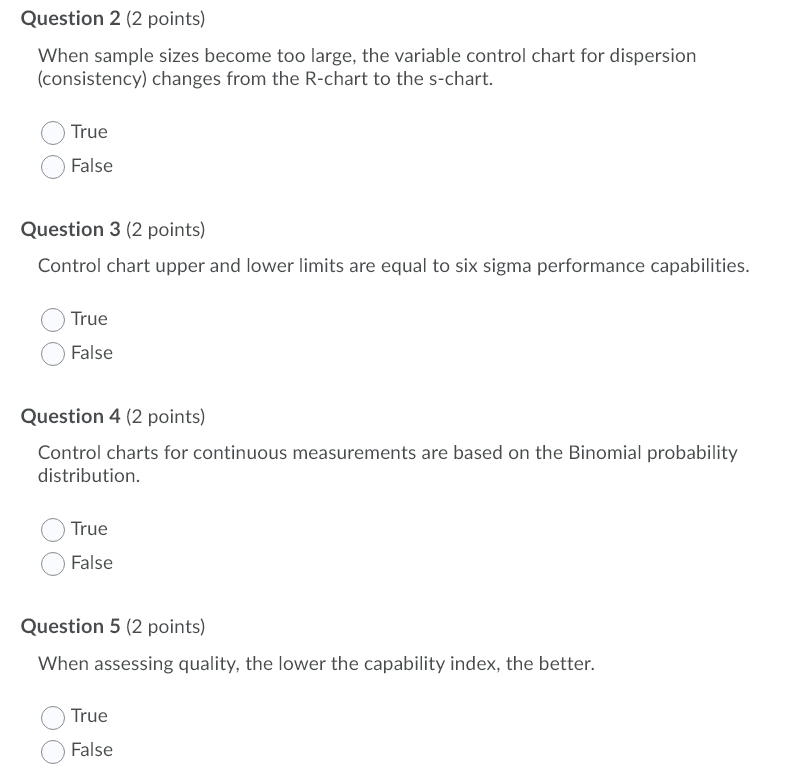
Question: Question 2 (2 points) When sample sizes become too large, the variable control chart for dispersion (consistency) changes from the R-chart to the s-chart. True

Question 2 (2 points) When sample sizes become

Question 2 (2 points) When sample sizes become too large, the variable control chart for dispersion (consistency) changes from the R-chart to the s-chart. True False Question 3 (2 points) Control chart upper and lower limits are equal to six sigma performance capabilities. True False Question 4 (2 points) Control charts for continuous measurements are based on the Binomial probability distribution. True False Question 5 (2 points) When assessing quality, the lower the capability index, the better. True False

Step by Step Solution

There are 3 Steps involved in it

1 Expert Approved Answer
Step: 1 Unlock blur-text-image
Question Has Been Solved by an Expert!

Get step-by-step solutions from verified subject matter experts

Step: 2 Unlock
Step: 3 Unlock

Students Have Also Explored These Related General Management Questions!